History Doesn't Favor the Stock Bulls After Sell-Off
The rally drove price-to-earnings ratios above 33, to levels only matched at the height of the dot-com bubble.

(Bloomberg Opinion) -- The S&P 500 Index reached a record high in September, extending the longest bull market in history and generating an inflation-adjusted return of 300 percent since March 2009. The rally drove price-to-earnings ratios above 33, to levels only matched at the height of the dot-com bubble. The S&P 500 is now down 15 percent from its September high, reducing the P/E ratio to 28.
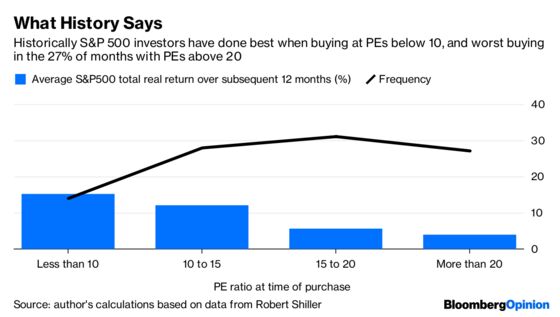
So what does history suggest might happen in 2019? On average, the outlook is not good when stocks are falling, but still expensive. The table below shows that historically, investors have done best when buying at P/E ratios below 10 and worst when buying in the 27 percent of months with P/E ratios above 20. (The data come courtesy of Yale University Professor Robert Shiller, whose cyclically adjusted price/earnings ratio, or CAPE, is the best generally available information.)
On the other hand, on average, dips are buying opportunities. Investors who buy when the P/E ratio has fallen more than 10 percent over the previous year average a 9.6 percent real return over the subsequent year, compared with 8 percent in other times. The table below shows average one-year S&P 500 real returns by the combination of the P/E ratio at the time of purchase, and the change in the ratio from one year before purchase to the time of purchase.
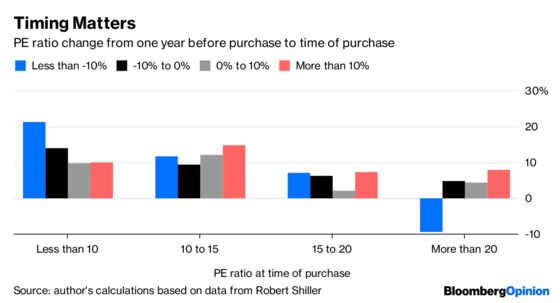
The current situation is bolded in the lower left cell of the table, which happens to be the only cell with an average negative number. If you buy cheap, you do even better if P/E ratios are falling, but if you pay top prices, you only do well if P/E ratios are going up.
There have been 55 months since 1871 when the P/E ratio was above 20, but also down more than 10 percent in the prior year. Of those, 40 were early months of major crashes, such as in May 1902, November 1929, November 2000 and January 2008. One-year losses averaged 20 percent after those 40 months. However, 15 months represented corrections within bull markets. Investors with the courage to buy in these months enjoyed positive 20 percent average real returns over the subsequent year.
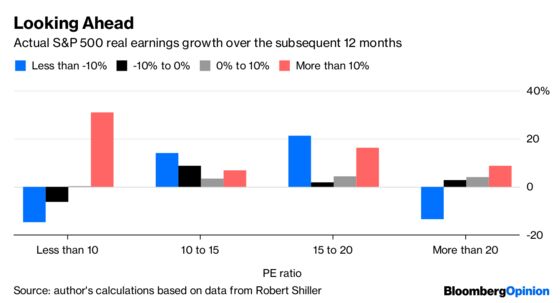
When P/E ratios are high and increasing, it suggests the market expects strong earnings growth. The table below shows actual S&P 500 real earnings growth over the subsequent 12 months.
The next table covers the other half of the price equation. There are two ways for the stock market to go up: either real earnings increase or P/E ratios increase. The table shows the increase in P/E ratios over the subsequent 12 months.
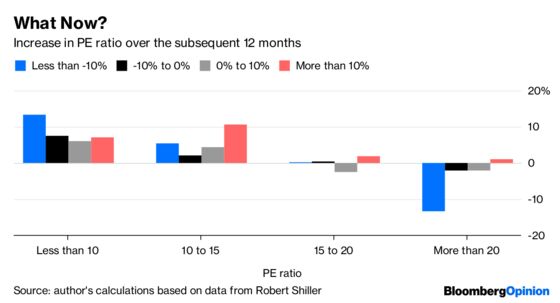
Now we see why historical returns are so spectacularly bad when P/E ratios are high and falling. On average, both earnings and ratios fall sharply over the subsequent 12 months. The former is mainly a consequence of buying at a high P/E, the latter mainly due to buying when they are declining. Multiply them together and the historical results are not pretty.
Of course, history is not destiny and there are the 15 examples of months in which investors were rewarded for paying up when stock prices are falling. Moreover, no investment decision should be made on the basis of two aggregate numbers. The market has reasons for pushing P/E ratios so high. They don't occur in a vacuum. But if the S&P 500 does lose more than 10 percent after inflation in 2019, don't say there was no way to see it coming.
My guess about this is that at moderate P/E ratios, investors hope to make money from increasing ratios rather than higher earnings.Therefore, P/E ratios go up or down depending on predicted market sentiment rather than earnings expectations. But if you buy at very high P/E ratios, you pretty much have to look for earnings growth to generate profits; while if you buy at low P/E ratios, your main worry is earnings declines rather than changing investor moods.
To contact the editor responsible for this story: Robert Burgess at bburgess@bloomberg.net
This column does not necessarily reflect the opinion of the editorial board or Bloomberg LP and its owners.
Aaron Brown is a former Managing Director and Head of Financial Market Research at AQR Capital Management. He is the author of "The Poker Face of Wall Street." He may have a stake in the areas he writes about.
©2019 Bloomberg L.P.