Ranking the Trump Economy
The president brags about U.S. prosperity. But conditions improved more under his predecessors. (Even Carter.)

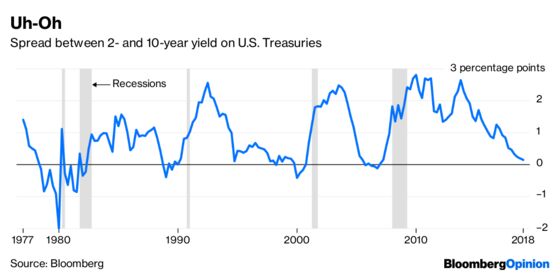
(Bloomberg Opinion) -- Stock and bond markets are flashing warning signs of a U.S. recession just over the horizon, and President Donald Trump is having none of it:
Investors may be gloomy about the vanishing gap between short- and long-term U.S. Treasury yields, the dreaded yield-curve inversion that tends to forecast recessions, but the president is focusing on the bright side.
The U.S. economy is indeed doing well in many ways. Job gains and consumer spending are robust, wages are rising, inflation isn’t a problem. Things have slowed down lately and optimism has waned a bit, but the conventional economic indicators have been strong.
In Trump’s view, that entitles him to claim that his administration has produced “the strongest economy in the history of our nation,” as he put it last June. But while the recession forecasts have not been proven right, Trump’s boast can pretty much be proven wrong.
Measured by 14 gauges of economic activity and financial performance, the U.S. economy is not doing as well under Trump as it did under all but one of the four Republicans and three Democrats who have occupied the White House since 1976.
These yardsticks, compiled by Bloomberg, assess a broad range of activity — from job and wage growth to the strength of the real estate and auto industries to the health of stock and bond investments that deliver security to workers and retirees alike. They are:
- Total nonfarm payrolls
- Manufacturing jobs
- Value of the dollar compared to major currencies
- Gross domestic product
- Federal budget deficit (or surplus) as a percentage of GDP
- Disposable income per capita
- Household debt as a percentage of disposable income
- Home equity
- Car sales
- Hourly wages
- Productivity
- Bond-market performance
- The Standard & Poor’s 500 Index of U.S. stocks
- Gap between U.S. and global stock performance
By compiling and ranking the annual improvement in these measures under each of the last seven presidents, an average economic-progress score can be assigned. The scoring gives equal weight to each measure to avoid confusion over valuations that anyone could consider arbitrary. By these measures, we reported two years ago, the economy under President Bill Clinton was No. 1. It still is, having strengthened the most during his years in office, 1993 to 2001. President Barack Obama, who took office in 2009 during the worst recession since the Great Depression, left in 2017 after the second-biggest improvement. President Ronald Reagan is No. 3 (1981-1989), followed by Presidents George H.W. Bush (1989-1993) and Jimmy Carter (1977-1981).
That leaves Trump and President George W. Bush, whose years in office ended in 2009 with the financial crisis that plunged the economy into its deepest decline in 80 years. While the No. 6 Trump economy shows no signs of replicating the disaster of the No. 7 Bush economy, he already lags Carter’s performance.
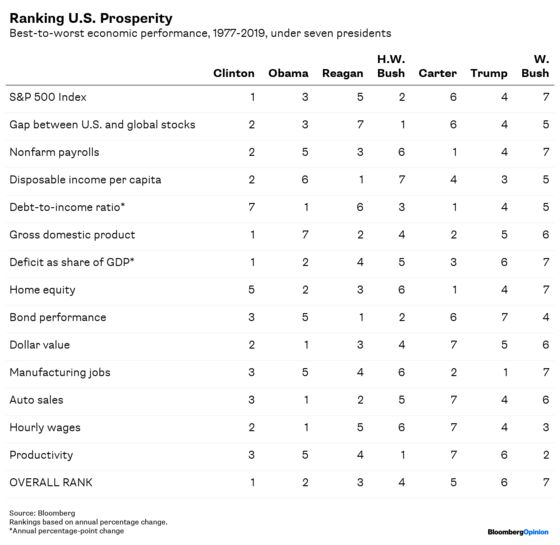
For all of its weakness, the Carter economy included the largest annual increase in nonfarm payrolls and tied with Reagan’s for the second-most annualized growth in gross domestic product. Carter’s economy also saw the biggest annual increase in home equity.
Trump benefits from GDP growth that leads the Group of Eight industrial nations, the lowest unemployment since the 1960s and, as he correctly tweeted on Jan. 21, “the best year for American Manufacturing job growth since 1997.” But Clinton tops the list of 14 measures in three categories, is second in six indicators and third in three of them. Obama wins four of the 14 measures and ranks second in two of them.
The Trump years have been no better than average and mostly below average in 12 of the 14 measures. The bond market suffered its worst performance the past two years than in any other presidency since Carter. Anemic productivity and a widening deficit as a percentage of GDP are the worst since George W. Bush was president. The dollar’s 3.2 percent annualized decline and GDP growth of 2.24 percent give Trump no better than a No. 5 ranking.
What worries investors most under Trump is the increase in uncertainty about the economy. That’s reflected in wide stock-market swings tracked by the 100-day volatility of the S&P 500 and a similar measure of the Nasdaq index, which are at their highest levels since 2012. Another cause for concern is the narrowing interest-rate gap between bonds and money market instruments, or the so-called flattening yield curve when short-term rates overtake long-term ones. At least four previous recessions ensued when the yield curve inverted, as part of it did in December, which helps explain the market’s recent fluctuations and convulsions.
Trump didn’t help himself when he installed Jerome Powell as chair of the Federal Reserve instead of giving Janet Yellen a second term. Under Yellen, volatility in the stock and bond markets was lower than at any point under her predecessors Ben S. Bernanke and Alan Greenspan during the preceding 28 years. Yellen’s Fed focused on growth, productivity and increasing the labor participation rate if it meant eschewing tighter credit policies. Powell initially revealed no such assurance and pushed borrowing costs up, asserting the central bank’s independence to Trump’s chagrin.
And squeezing the brakes on a Trump economy that the president can’t seem to make great again.
(With assistance from Shin Pei)
To contact the editor responsible for this story: Jonathan Landman at jlandman4@bloomberg.net
This column does not necessarily reflect the opinion of the editorial board or Bloomberg LP and its owners.
Matthew A. Winkler is a Bloomberg Opinion columnist. He is the editor-in-chief emeritus of Bloomberg News.
©2019 Bloomberg L.P.