(Bloomberg Opinion) -- In the 12 months after the Tax Cuts and Jobs Act took effect Jan. 1, 2018, federal government receipts fell by $13.7 billion, or 0.4 percent, while outlays rose $176.7 billion, or 4.4 percent. Those aren’t official numbers, because the Monthly Treasury Statement for December isn’t out yet and probably won’t be until the partial government shutdown is over. But the lights are still on at the Congressional Budget Office, and it released revenue and spending estimates for December on Tuesday.
At first glance, this makes it look like (1) the tax cuts did in fact cut taxes, as promised, but (2) the revenue loss was much smaller than the increase in spending, so the $190.5 billion increase in the federal deficit from calendar-year 2017 to 2018 is almost entirely due to higher spending. This is a popular refrain among supporters of the tax cuts, but it is incorrect. For one thing, it ignores inflation. And with December inflation numbers out today from the Bureau of Labor Statistics, we don’t have to do that!
Adjusted for inflation, federal receipts fell by 2.8 percent in 2018, and spending rose 1.9 percent. So the deficit increase wasn’t almost entirely due to higher spending. What’s more, in a growing economy, tax revenue tends to rise in inflation-adjusted terms even if there are no changes to the tax code. More people get jobs, incomes rise, corporate profits rise, etc. Here, for purposes of comparison, is how real federal revenue and spending have behaved in all the calendar years of the current expansion:
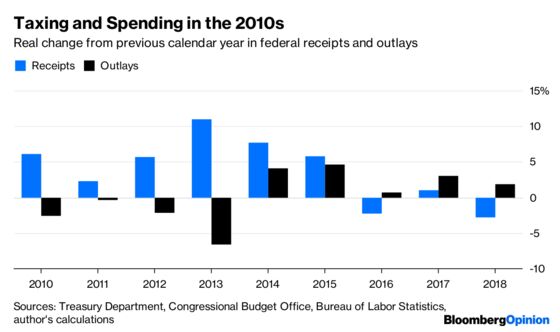
That revenue went down in 2016 in the absence of major tax changes is yet more evidence that the mini-recession of 2015 and 2016 was for real. But the economy sure wasn’t in a mini-recession in 2018 — it probably grew faster than in any other year of the current expansion. Some of that growth was surely due to the tax cuts (and spending increases), but probably not all. Tax receipts did rise in the year before the tax cuts, after all.
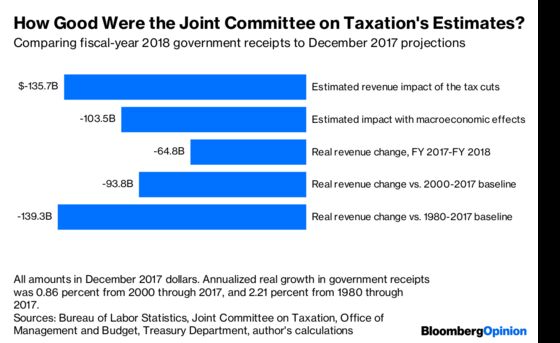
To get a better sense of the revenue impact of the tax cuts, then, one clearly needs not only to adjust for inflation but also to compare with some baseline of expected revenue growth. So I calculated a couple of baselines using historical data: annualized real revenue growth from 2000 through 2017, and from 1980 through 2017. The first period includes two recessions, one of them the worst in three-quarters of a century; major tax cuts in 2001, 2003 and 2009; and a bunch of tax changes in 2010 and 2013 that show up in Treasury Department estimates as big tax cuts but were mainly about keeping most of the 2001 and 2003 tax cuts from expiring. Annualized real revenue growth was just 0.86 percent. The second period features a better balance of tax cuts and hikes, growth, and recession, but it also covers a time when the working-age population was growing faster than it is now, enabling faster economic growth. Its revenue growth rate was 2.2 percent. The fairest baseline is probably somewhere in between.
Plug those numbers in, and real revenue in 2018 was down 3.6 percent from the 2000-2017 baseline, and 4.9 percent from the 1980-2017 baseline. Or, if you want to put it in current dollars, it’s down somewhere between $125 billion and $171 billion. I’m not going to bother with a spending baseline: Real spending has gone up over time, but it tends to slow and sometimes even drop a little when economic times are good. In any case, even without such an adjustment, a drop in real revenue versus the baseline of plus or minus 4 percent is a lot bigger than a 1.9 percent increase in real spending. Over the long run, it’s spending on things like Medicare, Social Security and interest on the debt that is projected to drive up the deficit. This year’s deficit increase, though, has been mainly about the tax cuts.
That increase in the deficit hasn’t necessarily been a bad thing. Nearly 3 million more Americans have jobs now than a year ago, and economists are in the middle of some big-time revisions in their attitude toward government debt. And taxes are lower! But this is no excuse for the thought crime of using unadjusted raw numbers in discussing the causes of that deficit.
For one thing, you can’t fairly evaluate government bean counters’ estimates of the revenue impact of tax bills — which tend to come in for lots of criticism from tax-cutting politicians — without adjusting for inflation and using some kind of growth baseline. Let’s do that with the Tax Cuts and Jobs Act estimates made in December 2017 by the staff of Congress’s Joint Committee on Taxation. The first calculated the revenue impact without factoring in any possible positive macroeconomic effects of the tax cuts, and the second was a “dynamic score” that did assume an increase in growth. The estimates were by fiscal year, which for the federal government ends in September, so that’s what I’ve used for comparison.
The gross domestic product deflator or one of the other deflators calculated by the Bureau of Economic Analysis might be a better inflation measure for these purposes, but (1) it doesn't make much difference over just one year and (2) we don't have one of those for all of 2018 yet, and might not for a while since the BEA is closed in the shutdown (the BLS isn't).
In this case using the Office of Management and Budget’s historical estimates of constant-dollar fiscal year spending.
To contact the editor responsible for this story: Brooke Sample at bsample1@bloomberg.net
This column does not necessarily reflect the opinion of the editorial board or Bloomberg LP and its owners.
Justin Fox is a Bloomberg Opinion columnist covering business. He was the editorial director of Harvard Business Review and wrote for Time, Fortune and American Banker. He is the author of “The Myth of the Rational Market.”
©2019 Bloomberg L.P.