What’s Killing U.S. Pedestrians? Streets That Weren’t Designed for Them.
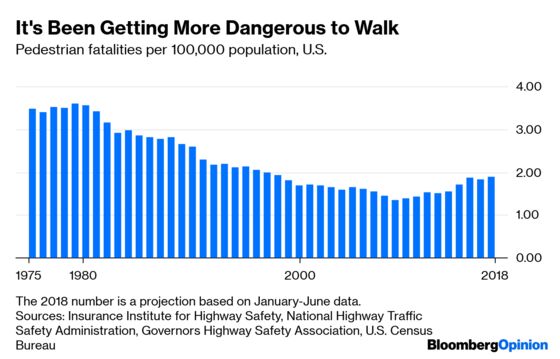
(Bloomberg Opinion) -- As you may have heard, since a lot was written about it a few weeks ago, pedestrian deaths are on the rise in the U.S. The Governors Highway Safety Association estimated, based on data from the first half of the year, that 6,227 pedestrians were killed in traffic accidents in 2018. This would be a whopping 50 percent more than were killed in 2009. Adjusted for population, the increase hasn’t been quite so steep, and seems like it might have halted after 2016. But after decades of declines, the turnaround since 2009 is still awful.
Among the explanations that have been trotted out:
- More cars are on the road, with vehicle miles driven rebounding after a big drop during the recession.
- More people are texting while driving, which wasn’t much of a thing before 2007, when the iPhone was introduced.
- More people are driving sport utility vehicles, which are harder to stop than cars and two to three times likelier to kill you if they hit you.
Those all make sense. But why is it, then, that New York City has seen a decline in pedestrian fatalities since 2009?
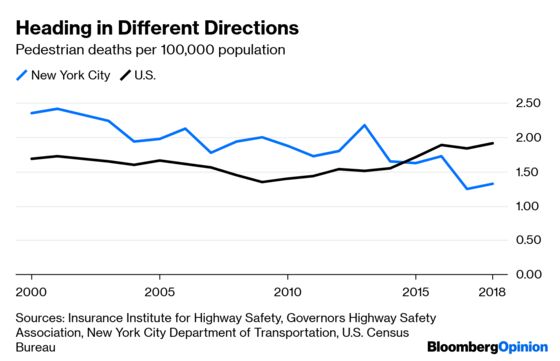
The city embarked five years ago on a Vision Zero program to reduce traffic fatalities, so that may be a factor. But the bigger issue seems to be that densely populated, pedestrian-packed cities such as New York simply aren’t where the main problem is these days. Here are the 2017 pedestrian fatality rates for the country’s 20 most-populous cities, taken from a new report by the National Highway Traffic Safety Administration. (Note that the New York rate is lower than the rate for 2017 in the above chart, which I calculated using city data, indicating that the above chart may understate the city’s relative advantage in pedestrian safety.)
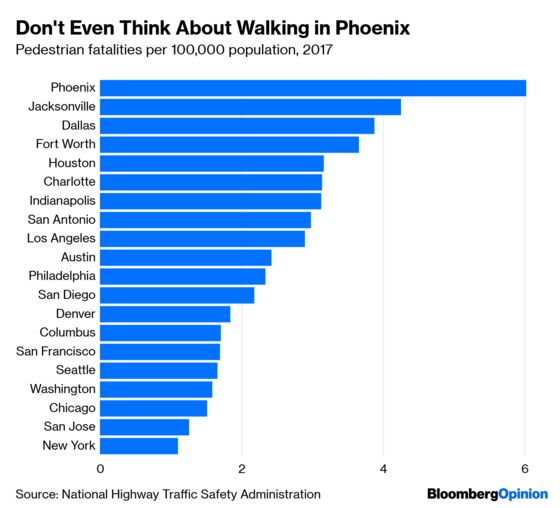
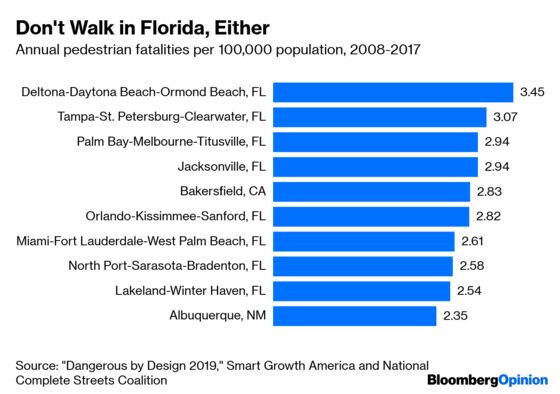
The most pedestrians are getting killed, then, in sprawling Sun Belt cities not known for having lots of pedestrians. In their suburbs, too. Here, from another new(ish) report, this one by the advocacy groups Smart Growth America and National Complete Streets Coalition, are the 10 U.S. metropolitan areas with the highest pedestrian fatality rates.
Where in these cities and suburbs are pedestrians getting killed? Not downtown or on residential streets, the Insurance Institute for Highway Safety found in a 2018 study. Most of the fatal accidents, and most of the increase, happened on arterials — those high-capacity roads of four lanes or more, often lined with strip malls, fast-food outlets and motels, that are such a defining (if less than universally admired) element of the modern American-built environment.
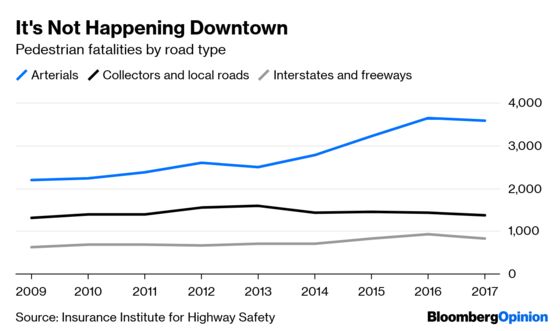
Pedestrian deaths have been on the rise along freeways, too — it doesn’t look like much in the above chart, but they’re up 33 percent since 2009, compared with a 64 percent rise in fatalities on arterials.
These crashes generally aren’t happening at intersections, which makes sense given that freeways don’t have any and arterial roads keep them to a minimum.
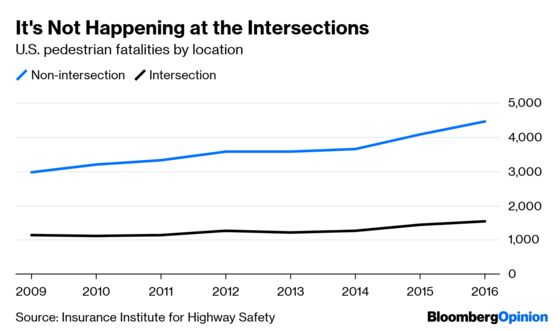
Where pedestrians are getting killed, then, is where there weren’t supposed to be any pedestrians. On freeways they’re generally not allowed at all, while along arterial roads the provisions made for them are often so sparse as to be worse than useless. In the most notorious pedestrian death of last year, a woman was hit by an Uber self-driving car as she crossed an arterial road in the dark in the Phoenix suburb of Tempe. The nearest crosswalk was 360 feet away. In a 2011 crash in suburban Atlanta that also got national attention, the nearest crosswalk was a full third of a mile away from the spot where a 4-year-old was killed by a hit-and-run driver as he and his mother crossed a four-lane road to get from their apartment complex to a bus stop.
Local authorities have often reacted to these tragedies by blaming the pedestrians for walking where they shouldn’t: In the 2011 Atlanta case, a jury actually convicted the mother of vehicular homicide while the driver pleaded guilty to a lesser charge (after much uproar the verdict was thrown out, although as part of the deal the woman did have to plead to jaywalking). A more constructive response would be to set up more places for pedestrians to cross safely, especially near transit stops, and that does seem to have been happening lately in the Atlanta area. But change is going to be difficult and slow given that these roads and neighborhoods were designed around the assumption that no one would be walking, drivers have more political clout that pedestrians, and the victims tend to be poor.
Poor people often have to walk because they don’t have access to a car. Governing magazine did an investigation a few years ago that found that pedestrian death rates rose as neighborhood incomes fell. This has likely become more of a problem as cities and close-in suburbs where walking is relatively safe have gotten more expensive relative to the suburbs, and poverty is an increasingly suburban phenomenon. What’s more, the denser metropolitan areas of the Northeast and West Coast have gotten more expensive relative to their sprawling, pedestrian-unfriendly Sun Belt peers. So we can probably add pedestrian fatalities to the long list of societal ills caused by overly restrictive land-use policies that restrict new housing and thus drive up prices.
One final twist is the age breakdown. Kids are now the group least at risk of getting killed while walking, which wasn’t always the case. And while those 70 and older remain the highest-risk group, their fatality rate has plummeted from several times that of other adults to barely higher.
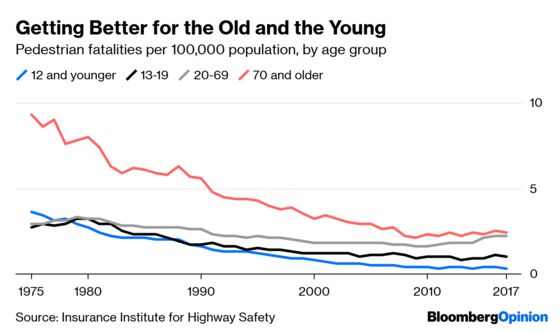
The decline in the fatality rate for those 12 and under seems to be a happy side effect of the otherwise much-lamented rise of helicopter parenting. Kids who used to wander around town unsupervised after school and during summer vacations (like I did in the 1970s) are now shuttled from class to practice to class. Their lives may be overscheduled nightmares, but hey, at least they’re not getting run over!
With older pedestrians, one reason for the higher fatality rate is that they’re more likely to succumb to any injuries they suffer. Another is that, well, they’re slow — and as a result are, according to a 1993 study, “overrepresented in intersection crashes (particularly involving turning vehicles) and in crashes involving wide street crossings.” That elderly Americans are so much less likely to be victimized in such crashes than they were in the 1970s and 1980s has got to be in large part because they’re now so much more likely to be behind the wheel. The percentage of elderly Americans below the poverty line fell by more than half from the late 1960s to 2000, meaning that more could afford cars, while the share of those 70 and older with driver’s licenses rose from 46 percent in 1975 to 81 percent in 2016. This was mainly due to an especially sharp rise among women 70 and older, from just 28 percent in 1975 to 74 percent in 2016.
Among drivers, fatal-crash involvements per miles driven are pretty constant from age 35 through age 70, according to the Insurance Institute for Highway Safety, but begin to leap upward after age 70. So the increase in driving among the elderly, while it appears to have cut back on pedestrian fatalities among the elderly, may have also contributed to their big rise since 2009 among other adults.
The study examined pedestrian fatalities from 2010 through 2016, and the IIHS has 2017 data here.
This helps explain why San Jose, which generally fits the description of sprawling Sun Belt metropolis, is among the safest big cities for pedestrians. San Jose is quite affluent, with a median household income of $104,675. It also has the lowest poverty rate among the 20 biggest cities, and is tied with Fort Worth for the smallest percentage of households without cars (1.9 percent in 2017).
Disclosure: I got a ticket for texting while behind the wheel of my SUV a few years ago, so I'm part of the problem. I was stopped at a light and it's a small SUV, though.
To contact the editor responsible for this story: Brooke Sample at bsample1@bloomberg.net
This column does not necessarily reflect the opinion of the editorial board or Bloomberg LP and its owners.
Justin Fox is a Bloomberg Opinion columnist covering business. He was the editorial director of Harvard Business Review and wrote for Time, Fortune and American Banker. He is the author of “The Myth of the Rational Market.”
©2019 Bloomberg L.P.