(Bloomberg Opinion) -- There are lots of different ways to measure the size of the federal government. The most-used is probably federal spending as a share of gross domestic product.
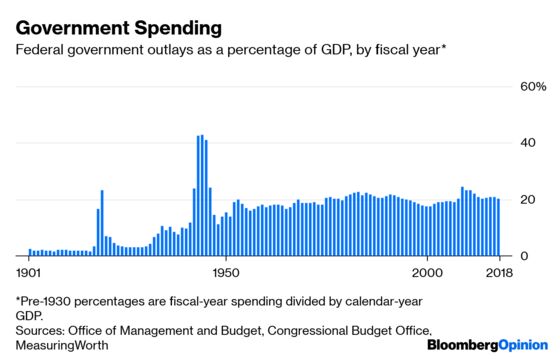
The picture this paints is of a federal government that grew spectacularly during the two World Wars, then settled down afterward at much higher levels than before. The New Deal years certainly show up in the chart, too, although they were dwarfed by what ensued, and there was a spending rise from the mid-1960s through the mid-1980s that was followed by a 15-year decline. In the aftermath of the global financial crisis, spending’s share of GDP jumped to its highest non-wartime level ever, but since then it has settled back to about where it was in the 1980s.
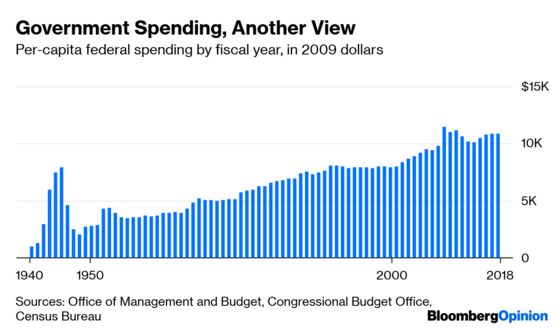
Whenever I run a chart that expresses government spending or revenue as a percentage of GDP, I hear from readers who tell me that’s dodgy and that I should just use dollars. Personally I care about what percentage of my income is taken by taxes, not the dollar amount, and I think percentage of GDP is a much better way of comparing government budgets across time or between nations. But here, just for the percentage-of-GDP-haters, is federal spending since 1940, adjusted for inflation and divided by population.
There’s been a big change through the decades in what that federal spending is going to. It used to be mostly on government activities, including the military, and investment in infrastructure and research. Now it’s almost two-thirds transfer payments, in which money is taken from one group of Americans and given to another.
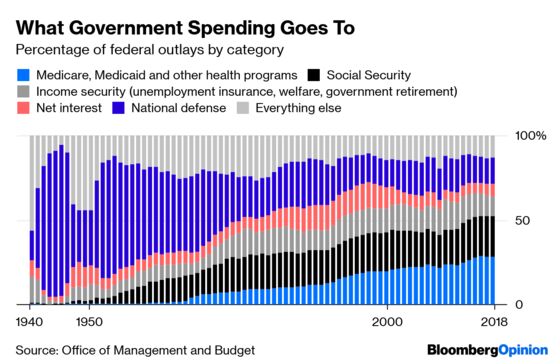
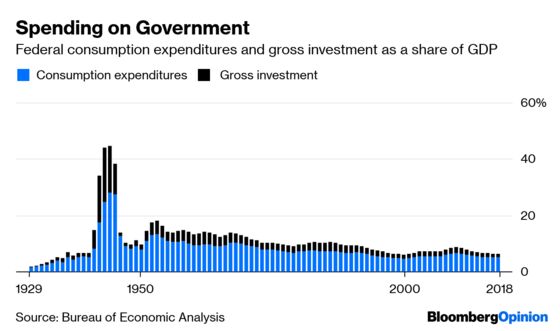
Clearly, some of these transfer programs, such as Social Security and unemployment insurance, are purer transfers than others. In health care in particular, government’s role is far more than just handing over checks. And even Social Security and unemployment insurance are government programs that move money around in different ways than the private sector would. Still, if you’re trying to get a grasp on how big the federal government is as an institution and how that has changed over time, it’s worth at least looking at a measure that throws out all the transfer payments: the Bureau of Economic Analysis’s federal government consumption expenditures and gross investment, here expressed as a percentage of GDP.
Federal government’s share of total nonfarm employment follows a similar, mostly declining trajectory. I have a government-shutdown-inspired piece in this week’s Bloomberg Businessweek on that. Here’s a version of the chart from it:
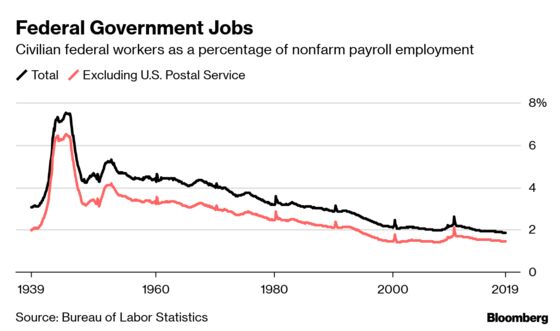
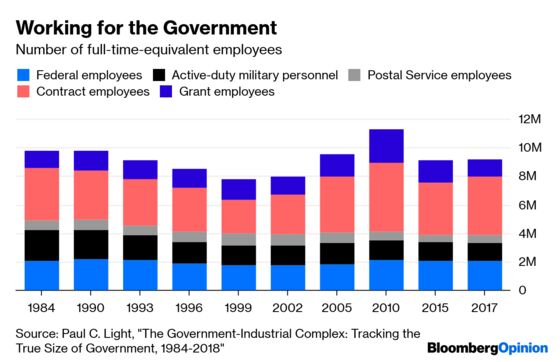
This of course leaves out government contractors, data on whom is “so inconsistent prior to 1984 that there is no way to estimate the total shadow workforce,” according to Paul C. Light of New York University’s Robert F. Wagner Graduate School of Public Service. Light does say federal consumption expenditure is a reasonable proxy, though, and he has estimates of the “shadow workforce” from 1984 onward. They show a big rise in the number of contractors in the 2000s, but a decline since then that has brought overall federal-government-funded employment back below 1980s levels.
The federal government exerts power and influence in ways that go beyond how much it spends and how many people it employs, of course. The most obvious of these is regulation, and while there’s no perfect measure of the size of the regulatory state, the George Washington University Regulatory Studies Center’s tallies of the number of pages in the Federal Register and the Code of Federal Regulations do give some sense of its reach. Here’s the former, which more or less represents the flow of new regulations.
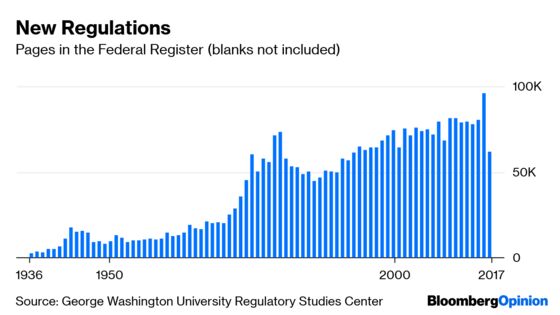
That’s a pretty spectacular drop in 2017, President Donald Trump’s first year in office. It represents less a regulatory rollback, though, than a lack of new regulations (also, interestingly, President Barack Obama presided over a decline in Federal Register pages in his first year in office too, albeit a much smaller one). It’s the Code of Federal Regulations that will give a sense of whether overall regulatory verbiage has actually declined, and the 2017 totals haven’t been tallied. It seems unlikely that they will show a big decline, though.
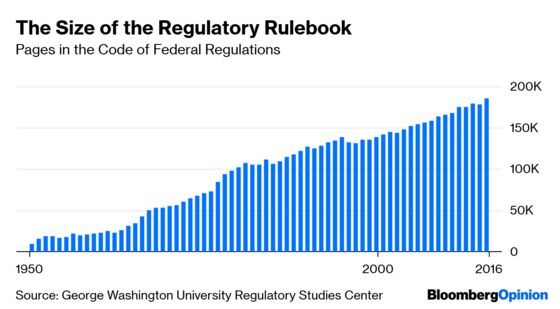
There are lot more pages of federal regulations than there used to be! Some of this rise in verbiage represents a change in regulatory style, as rules have gotten more detailed and presumably more full of boilerplate. There were surely more pages of federal financial regulations in 2008 than in 1980, but I don’t think it would be accurate to say that the financial sector became more tightly regulated over that period. Quite the opposite. Still, the added verbiage is in itself a burden, and overall I don’t think it’s wrong to say that regulation has grown, although the resources devoted to enforcing it sure seem to be smaller relative to the size of the economy.
So are you confused enough now about whether the federal government has been growing or shrinking or treading water? That’s kind of the point of this column: It’s harder to say than you might think.
The estimates in the chart are from Light's brand-new book, "The Government-Industrial Complex," but you can read about the pre-2017 numbers online in a report he wrote for the Volcker Alliance.
To contact the editor responsible for this story: Brooke Sample at bsample1@bloomberg.net
This column does not necessarily reflect the opinion of the editorial board or Bloomberg LP and its owners.
Justin Fox is a Bloomberg Opinion columnist covering business. He was the editorial director of Harvard Business Review and wrote for Time, Fortune and American Banker. He is the author of “The Myth of the Rational Market.”
©2019 Bloomberg L.P.