$3.3 Trillion of Global Debt Starts to Tip the Scale
(Bloomberg Opinion) -- Of all the reasons given for the slowdown in the global economy, it seems that the world’s ballooning debt load has fallen to near the bottom of the list for some reason. Perhaps it’s because interest rates haven’t shot higher as many expected, but large amounts of debt have other negative implications that may now be coming to light.
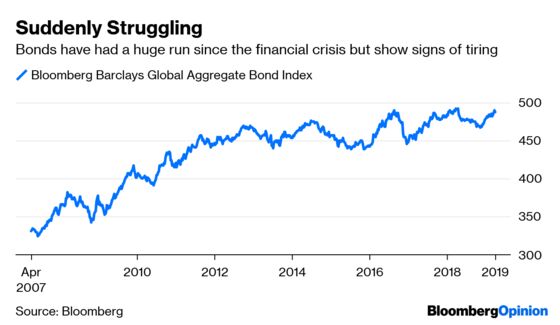
In 2012, Carmen Reinhart, Vincent Reinhart and Kenneth Rogoff wrote in a paper published on the National Bureau of Economic Research’s website that economies with high debt potentially face “massive” losses of output lasting more than a decade, even if interest rates remain low. Could that be happening now? A U.S. Commerce Department report showed on Tuesday that the three-month annualized rate of change in new orders for nondefense capital goods excluding aircraft — a series that provides insight into capital spending without undue volatility from aircraft orders — declined for the fourth consecutive month. At the same time, the Institute of International Finance issued a report saying that the mountain of global debt expanded by $3.3 trillion last year to $243 trillion, or more than three times worldwide gross domestic product. Total debt in the U.S. grew by $2.9 trillion to more than $68 trillion in the largest annual increase since 2007. What’s truly disturbing is that the IIF said U.S. nonfinancial corporate debt stands at 73 percent of GDP, close to its pre-crisis peak. That helps explain why the first quarter ushered in the most credit ratings downgrades for U.S. companies relative to upgrades since the beginning of 2016, according to S&P Global Ratings data compiled by Bloomberg.
As such, it’s not a stretch to think that companies are deciding it’s finally time to tighten their belts and get their debt under control, especially if the economy is possibly headed into a recession. “U.S. corporate debt relative to GDP reaching record levels is likely to hold corporate investment back, suggesting the economy will not develop sufficiently strong productivity gains to compensate for rising input costs such as wages,” the strategists at Morgan Stanley wrote in a research note.
THE BEST IS NOT YET TO COME
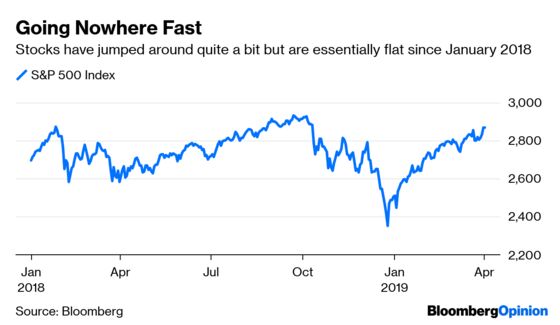
Despite the S&P 500 Index having soared 13.1 percent in the first three months of 2018, its best quarterly performance since 2009, those who are paid large sums to figure out where stocks go next are hesitant to get all bulled up. The median estimate of 24 strategists surveyed by Bloomberg is for the S&P 500 to gain only an additional 4 percent by the end of the year, rising to 2,950 from about 2,834 on Friday. That price target isn’t much different from the 2,913 median estimate back in early January. Count BlackRock as one firm that feels the easy money has been made in risk assets such as equities. “We see a repeat as unlikely and a narrower path for a grind higher,” Richard Turnhill, the firm’s global chief investment strategist, wrote in a research report. “The global economy must remain strong enough to quell recession fears but weak enough to keep policy makers on hold” to keep the rally in risk assets going. That’s a tough needle to thread. In reality, it’s been a relatively tough market for stocks the last 15 months. Consider that even with the big gains last quarter, at 2,867.24 on Tuesday the S&P 500 is still below its closing high of 2,872.87 in January 2018, let alone the record of 2,930.75 in September. And the only reason stocks are as high as they are is because of the tech sector, according to Eddy Elfenbein, a money manager who writes the Crossing Wall Street blog. “Many sectors and individual stocks never made new highs, and they’re still well below their January 2018 peak,” Elfenbein wrote. “For example, the S&P 500 Value Index never made a new high. It’s currently 6 percent below its peak from 14 months ago. The S&P 500 High Beta Index also never made a new high. The Consumer Staples sector is way down from its peak. The S&P 500 Industrials also never made a new high.”
CRYPTOS SHOW SIGNS OF LIFE
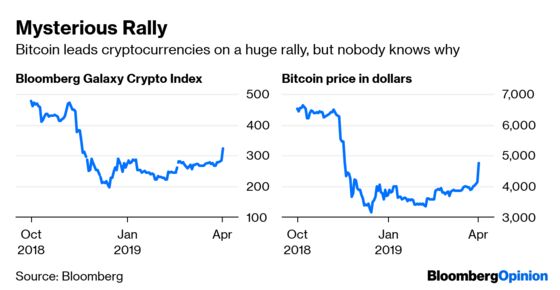
Those who believe that cryptocurrencies will someday take over the global financial system have been pretty quiet for the last year as prices collapsed. But they were out in full force on Tuesday as the market suddenly spiked. The Bloomberg Galaxy Crypto Index soared as much as 15 percent to its highest level since November. Crypto poster child Bitcoin jumped as much as 23 percent in its biggest gain in more than five years, rising above $5,000 at one point (which is still a long way from the $20,000 or so it reached during the frenzy of late 2017). As if on cue, crypto promoters were predicting even more gains, with one saying Bitcoin will surely reach $7,000 in short order. The thing is, though, nobody really knows what’s behind the sudden move. And if you don’t know what’s behind a move, how can you accurately predict anything? The strategists at Richardson GMP had a nice roundup of all the reasons given for the sudden surge: 1) A short covering/squeeze that was triggered when Bitcoin recently moved above $4,000; 2) A blockchain conference in Seoul; 3) An exchange of pounds for Bitcoin by British citizens in case Brexit goes horribly wrong; and 4) An April Fools’ Day story on an obscure crypto website claiming the U.S. Securities and Exchange Commission approved Bitcoin exchange-traded funds.
THE TREND ISN’T EM’S FRIEND
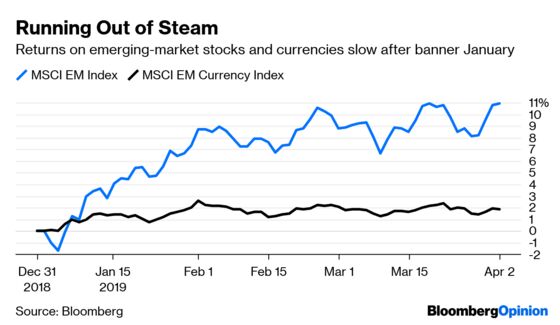
No matter how you measure it, the first quarter was great for emerging-market assets. The MSCI EM Index of equities jumped 9.56 percent for its best showing since the first three months of 2017, while a sister index tracking their currencies gained 1.62 percent. The Bloomberg Barclays EM Hard Currency Aggregate bond index soared 4.93 percent for its best performance since 2012. But rather than doubling down, international investors seem to be losing interest in EM. The IIF says nonresident flows into EM financial assets declined in each of the first three months of the year, from $52.6 billion in January to $31.2 billion in February and $25.1 billion in March. “The most profound dovish shift from the Fed since 2016 and more constructive trade talks between China and the U.S. were positive catalysts,” the IIF wrote in a report. “We believe weak capital flows to EM reflect the positioning overhang we have been writing about recently.” In other words, investors loaded up on EM assets as they tumbled last year, betting that the slide was overdone. That left them overexposed, and the declining trend line in flows reflects a rebalancing. As such, it looks as if EM stocks and bonds may be in for a tough slog until that “positioning overhang” gets resolved.
DIAMONDS ARE BEING MARKED DOWN
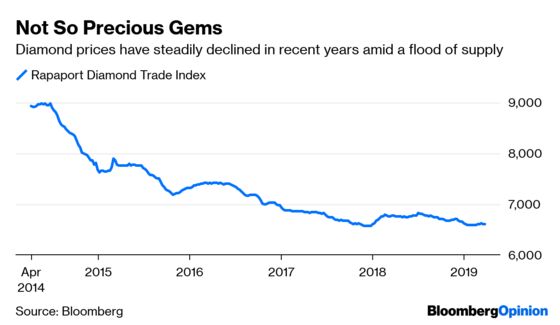
Given the tremendous growth in ETFs, it’s hard to come up with an asset that isn’t covered by the market. That makes diamonds conspicuous by their absence. There was the PureFunds ISE Diamond/Gemstone ETF, but it folded in January 2014 after only about 14 months. But now, the U.K.’s financial regulator added a small diamond pricing firm to its roster of companies managing market benchmarks, according to Bloomberg News’s Thomas Biesheuvel. The move will allow financial institutions to offer products such as ETFs that reference its pricing. But despite a generally solid economy the past few years, diamonds have been a horrible investment. The average price for a top 25 quality, 1 carat diamond with a clarity between internally flawless with no inclusions or marks on the surface to very slight inclusions has dropped 45 percent since 2011, according to the Rapaport Diamond Trade Index. Much of the decline can be pegged to oversupply, but Panmure Gordon Ltd. figures that may be about to change. Biesheuvel reports that the firm estimates that there may be a deficit of 15 million carats, or about 10 percent of the global supply, in 2021.
TEA LEAVES
The Institute for Supply Management’s manufacturing report Monday showed that part of the economy seems to be doing just fine despite all the talk of an economic slowdown. On Wednesday, we’ll find out whether consumers are doing just as well. The median forecast of economists surveyed by Bloomberg is for ISM to say that its monthly non-manufacturing index came in at 58 for March. While that would be down slightly from 59.7 in February, it’s still lofty territory. The measure is a diffusion index, meaning readings above 50 denote expansion and those below 50 signal contraction. To be sure, these are surveys and the results can differ significantly from “hard data” that record what companies and consumers are truly doing, not what they say they are doing.
DON’T MISS
The Fed Might Still Blunder Into a Recession: Tim Duy
Bond Market Hops Aboard Carousel of Progress: Brian Chappatta
For Emerging Markets, a Stronger China Is No Blessing: Shuli Ren
Beware the Buyer’s Strike in Corporate Bonds: Marcus Ashworth
Utility Investors Set Themselves Up for a Shock: Stephen Gandel
To contact the editor responsible for this story: Daniel Niemi at dniemi1@bloomberg.net
This column does not necessarily reflect the opinion of the editorial board or Bloomberg LP and its owners.
Robert Burgess is an editor for Bloomberg Opinion. He is the former global executive editor in charge of financial markets for Bloomberg News. As managing editor, he led the company’s news coverage of credit markets during the global financial crisis.
©2019 Bloomberg L.P.