The Year In Review: Ten Charts
The Year In Review: Ten Charts
(Bloomberg) -- Sign up to receive the Green Daily newsletter in your inbox.
At the end of every year, I like to look back on my work and see which themes and findings are as striking now as they were months ago. I’ve chosen ten ideas – and the ten charts to go with them – that I believe capture where we are right now in our efforts to deeply decarbonize the global economy. The ten range from capital formation to corporate boardroom composition to back-testing electricity demand outlooks from seven decades ago. This week we’ve got the first five; tune in next Thursday, December 23, for the 2nd half of the list.
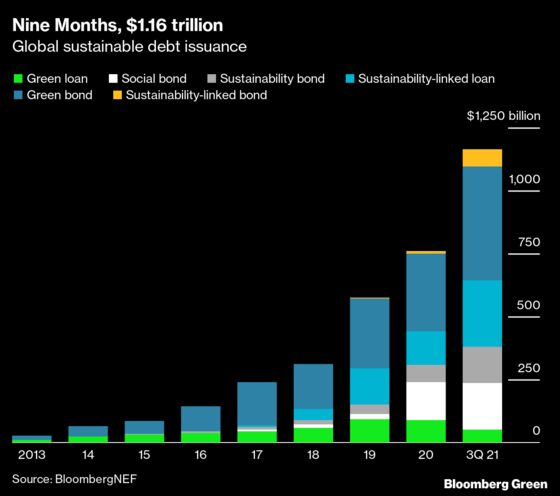
$1.1 Trillion of Sustainable Debt in Nine Months
Sustainable debt products – loans and bonds with proceeds targeted to positive environmental investment or to furthering company social goals – only emerged as an instrument class eight years ago. Since then, issuance has skyrocketed, exceeding $750 billion in 2020. At that time, BloombergNEF expected that another year of similar growth would get the world to its first year of $1 trillion of sustainable debt issuance. That did indeed happen in 2021, but it did not take the full year, or even a full three financial quarters. By the end of September, companies, banks, and government entities had issued more than $1.1 trillion of sustainable debt.
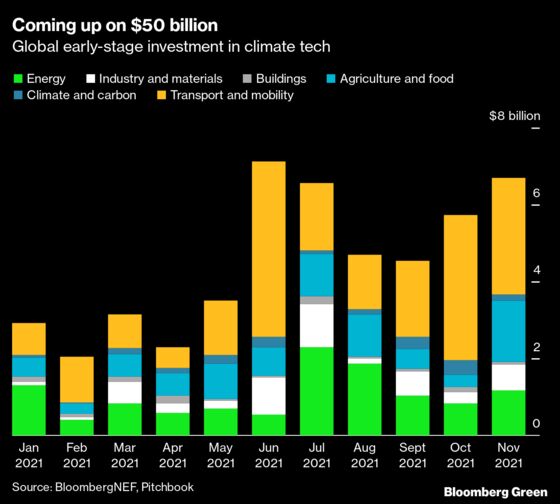
Climate Tech Investment
Early-stage investment in climate tech companies has skyrocketed. A decade ago, climate-focused companies were able to raise a few billion dollars, max, across asset classes, deal stages, and technologies. Now, climate tech companies are raising that much in a month, and at every stage, from pre-seed funding to billion-dollar pre-IPO rounds. Through November, climate tech companies have raised more than $49 billion for early-stage activity. Seems likely that the last few weeks of investing activity will tip that over $50 billion for 2021.
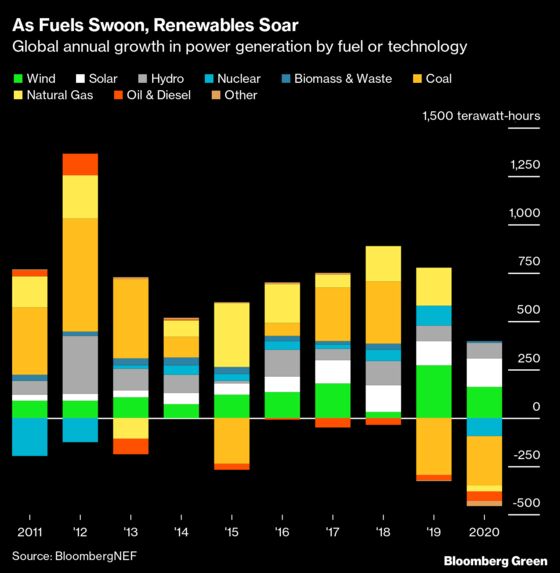
Heady valuations and investor FOMO combined with the very real need to fund planetary-scale innovation provide quite a tailwind for climate tech. As readers can well imagine, 2020 was a dynamic year for the global electricity sector. Despite massive and in many cases near-immediate changes in demand due to the Covid-19 pandemic, global power generation fell only two-tenths of a percent for all of 2020. Coal- and gas-fired power, and nuclear power, all declined year on year. Renewables, meanwhile, grew. More than just growing, though – renewables were the only growth in power generation last year.
Late-stage fundraising also is on fire. What might investors do with all that capital? I suggested that they come for the tool, and stay for the network. Some of those investors who raised multi-billion dollar private equity funds are doing exactly that, starting with electric vehicles in India.
All these numbers are a sign of enthusiasm, but they’re also an implicit promise from founders to investors that their companies will grow to match expectations. Here’s hoping, for the climate’s sake, that a healthy number of highly-valued climate tech startups succeed in that.
Renewables — The Only Growing Power Generation Source
Wind generation has a 16.6% compound growth rate in the past decade; solar, a 38.8% rate. That means that generation from each technology doubles in less than five years and less than two years, respectively. If wind generation were to grow at its current 10-year rate for just one more year, it would become the single biggest source of new power generation since 2010. If solar were to grow in the same fashion, it would be the biggest contributor to power generation growth by 2023.
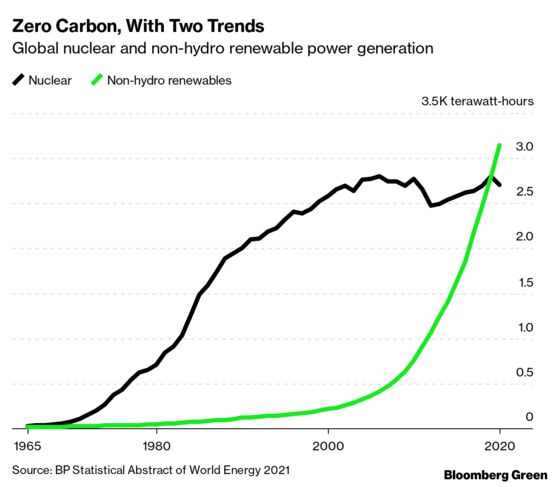
Renewables > Nuclear
In 1965, nuclear power generated 24 terawatt-hours a year. All wind, solar, geothermal, and biomass power plants generated 15 terawatt-hours. For four decades, the gap between nuclear and renewable generation widened. Starting in the 2000s, though, nuclear generation plateaued, and renewables kept right on increasing in a smooth, steep curve. The result: renewable power generation exceeded nuclear generation in 2020.
From a climate perspective, nuclear and renewables are not in competition. There will be enough growth in electricity demand to support significant expansion of every zero-carbon power generation technology. Some of that expansion could even come from fusion, as the investors who recently placed $1.8 billion into Commonwealth Fusion Systems hope.
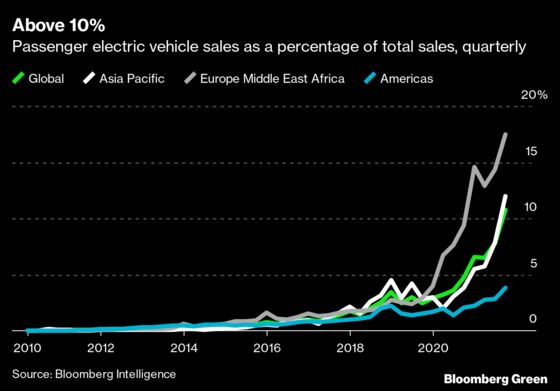
Electric Vehicles Now 10% of Passenger Car Sales
In the first quarter of 2010, 395 electric vehicles total were sold worldwide. Last quarter, 1.7 million were sold, of which more than half were in Asia. That sales growth has taken EVs from 0.002% of passenger car sales to 10.8% of sales globally, and more than that in both Europe and Asia.
China’s electric vehicle sales growth in particular is extraordinary. The world’s largest car market is now nearly 20% EV sales on a monthly basis. To put its sales in perspective: U.S. buyers have picked up 2.2 million EVs to date. China’s vehicle buyers have bought more than that many EVs from February through October of this year.
Nathaniel Bullard is BloombergNEF's Chief Content Officer.
©2021 Bloomberg L.P.