Why the Yield Curve Is Flattening (And What That Means)
Why Yield Curves Can Be Bull or Bear, Flat or Steep: QuickTake
(Bloomberg) -- In bond markets across the world, yield curves are twisting and turning -- and flattening. The curve is a summary of the spreads between the yields on short-, medium- and long-term sovereign debt. In the second half of this year, from the U.S. to South Korea, gaps have been narrowing between long- and short-term rates as investors weigh the odds that the current surge of inflation will prompt central banks to move more quickly to dial back their massive pandemic-triggered monetary support of the economy than they had planned to. That outlook -- some central banks are already reversing course, including the Reserve Bank of New Zealand -- risks weighing down economic activity.
In the U.S., money-markets imply the Federal Reserve will lift its policy rate potentially more than once in 2022, after it’s likely to have wrapped up the tapering, or winding down, of its bond-buying stimulus program.
Here’s a look at what four kinds of movements in curves typically mean. First of all, for debt-market newbies, remember that bond prices and yields move in opposite directions. The amount of money a bondholder is due to receive is predetermined, so if one pays less to acquire a security, then the expected return -- or yield -- goes up. That means that when there’s a bullish move in bonds (that is, people are buying them), yields go down. Conversely, when there’s a bearish shift, yields rise. On top of that, each of these can take place while the curve is either steepening (the premium for longer debt is growing) or flattening (the premium is shrinking).
Bear Flattening
Recent example: U.S. Treasury curve from March 2021 onward

What happens: Bonds sell off, regardless of maturity, with prices falling and yields rising. That explains the “bear” part of the trade. The flattening occurs when shorter-dated securities see their prices weaken the most, increasing their yields at a faster pace than those at the long end. That compresses the spread between the two, flattening the curve overall. Moves like this can take place if the Fed tightens policy or as traders begin to speculate and price in to their bets the expectation that the Fed will tighten in the future, as has been increasingly the case in the markets in 2021.
Bear Steepening
Recent example: The U.S. Treasury curve from the first quarter of 2020 through March 2021
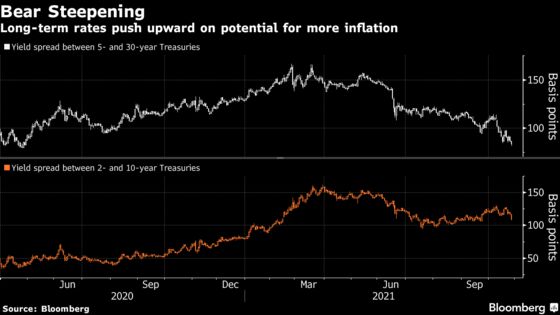
What happens: This type of shift could come when the Fed already has rates close to zero and pushes them a few notches lower while also flooding the system with liquidity (as it did during the height of pandemic risks) -- and while signaling that it plans to keep short-term rates anchored for years to buoy growth and gin up inflation. The waves of fiscal stimulus unleashed in 2020 to help U.S. output as the pandemic wreaked havoc on business also helped send long-term yields higher as policy makers sought to revive the economy -- steps that raised the prospects down the road for rising inflation, which, in fact, has surged.
Bull Steepening
An example: U.S. Treasury curve from mid-2007 into 2008
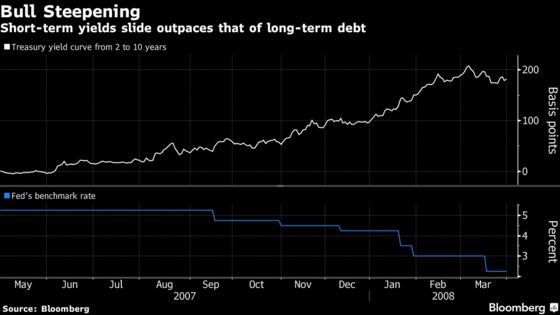
What happens: When the market goes into a bull steepening, bonds rally, dragging down yields. Steepening occurs because shorter-dated securities gain the most, pushing their yields down by more than those at the long end. That widens the spread between the two. This type of shift could occur when the Fed’s slashing its short-term benchmark interest rates, as it did after the 2008 financial crisis -- or even sooner, when traders anticipate the Fed’s moves.
Bull Flattening
An example: U.S. Treasury curve from fourth quarter 2018 through August 2019.
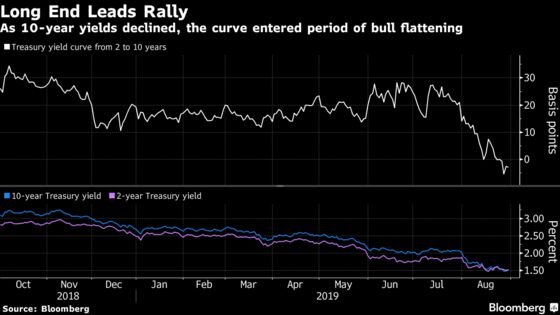
What happens: Bonds rally for all maturities, with prices rising and yields falling. That explains the “bull” part of the trade. The flattening occurs because longer-dated securities gain the most, pushing their yields lower by more than those at the short end. That compresses the spread between the two, making the curve flatter. This kind of move could happen, for example, when the Fed is holding rates steady but other forces - such a geopolitical frictions - are weighing on growth prospects, or tepid inflation readings encourage buying of longer-term Treasuries (inflation eats away at the fixed payments bonds pay).
The Reference Shelf
- A Bloomberg News article on the Fed fueling curve steepening.
- A QuickTake on how Fed could step in to control the yield curve.
- Frequently asked questions on the yield curve from the Federal Reserve Bank of New York.
- Fed Reserve Bank of San Francisco on what makes the yield curve move.
©2021 Bloomberg L.P.