Ascent of a More Diverse Democratic House: Demographic Trends
Ascent of a More Diverse Democratic House: Demographic Trends
(Bloomberg) -- The diversity of the Democratic majority that won House seats in the midterms earlier this month reflects demographic changes in the country as three-quarters of congressional districts became more ethnically and racial mixed since the 2016 election.
With one seat still undetermined, Democrats saw their largest one-time gain since the 1974 elections, and currently hold 234 seats versus 200 for Republicans. Thus, eighteen seats separate each party from the 218 needed for majority control.
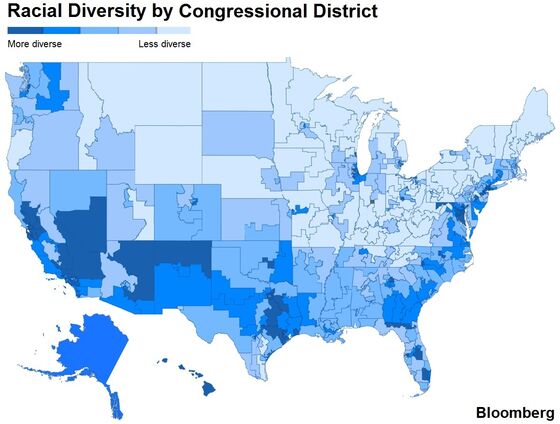
Bloomberg scored all 435 congressional districts by racial and ethnic makeup of constituent populations to uncover some demographic trends emerging from the 116th United States Congressional elections.
Key Insights
- Per 2017 U.S. Census data, white-alone, non-Hispanic, was the majority in 309 of the 435 districts, Hispanics in 34, black 19, Asian 1. The remaining 72 districts did not have any one race making up half the population.
- Among the 309 white-alone, non-Hispanic, majority districts, 60 percent of the districts are represented by Republicans, down from 71 percent before the mid-term election.
- Among the 126 districts where the white-alone population did not reach plurality, 88 percent are now represented by Democrats, up from 82 percent before the election.
- Democrat José E. Serrano continues to represent the least-white district in the country as the New York-15th congressional district counted only 2.5 percent of residents as being white-alone, non-Hispanic. Other least white districts included CA-40 (3.8%), CA-44 (6.5%), TX-29 (9.1%) and TX-9 (10.1%) all represented by democrats.
- Among the 100 least white districts, 93 are represented by Democrats
- Among the 50 least white districts, only 2 are represented by Republicans
- Compared to 2016’s diversity scores, 314 districts became more diverse, with the largest changes in the IL-6, CT-5 and NJ-4
- 99 districts became less diverse, most in the FL-26, TX-33 and CA-41 which all saw a greater concentration of Hispanics
- Less than one-third of top 100 most white, non-Hispanic districts are represented by Democrats
- About one-fifth of the top 50 most white, non-Hispanic districts are represented by Democrats
The diversity index was created based on the mathematical concept of the Herfindahl score, a gauge used in marketing and biodiversity, among many other applications, to detect monopoly. For example, a place where white, black, Asian and Hispanics populations are equally represented would have an H-score of 0.25 whereas any place 100% dominated by one race gets a score of one.
To contact the reporters on this story: Alex Tanzi in Washington at atanzi@bloomberg.net;Wei Lu in New York at wlu30@bloomberg.net
To contact the editor responsible for this story: Joe Sobczyk at jsobczyk@bloomberg.net
©2018 Bloomberg L.P.