This Is the Inversion Stock Investors Should Sweat
(Bloomberg Opinion) -- U.S. stock investors who are anxiously watching the yield curve are worried about the wrong inversion.
Investors have been howling about interest rates since Monday, when part of the U.S. Treasury yield curve inverted for the first time since 2007. The five-year Treasury yield dipped below that of the three year by a razor-thin 0.01 percentage points. Yawn.
Granted, that’s not supposed to happen. The yields for longer-term bonds should be higher than those for shorter-term ones to compensate bond investors for parting with their money for a longer period. When investors accept a lower yield for longer-term bonds, it implies that they expect interest rates to decline. And declining rates have often been accompanied by recessions and bear markets.
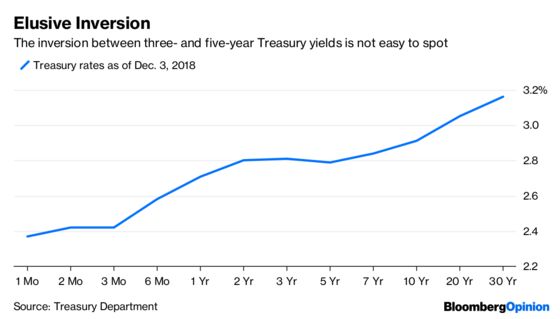
But the fuss is overdone, at least so far. The “inversion” is so minuscule that it’s imperceptible on an actual yield curve. It’s also limited to a small part of the curve. As others have already pointed out, an inversion between the two-year and 10-year Treasury yields would be more noteworthy.
Instead, investors should keep an eye on a different inversion: the difference between the earnings yield on stocks and the yield on cash. When the earnings yield has dipped below the cash yield in the past, stocks were in for a rough ride.
The first such inversion since 1934 — the earliest year for which yields are available for three-month U.S. Treasury bills — occurred in December 1965. The yield on T-bills rose to 4.4 percent, while the S&P 500 Index’s cyclically adjusted earnings yield, or the inverse of the price-to-earnings ratio based on 10-year trailing average earnings, fell to 4.2 percent. Stocks slipped into a bear market two months later, as defined by a decline of 20 percent or more in the S&P 500.
There have been six bear markets since then. In five of them, the earnings yield dipped below the cash yield soon before or just as the trouble began. The one exception was the dot-com boom. The earnings yield fell below the cash yield in October 1994 and stubbornly remained there until the bubble burst in March 2000.
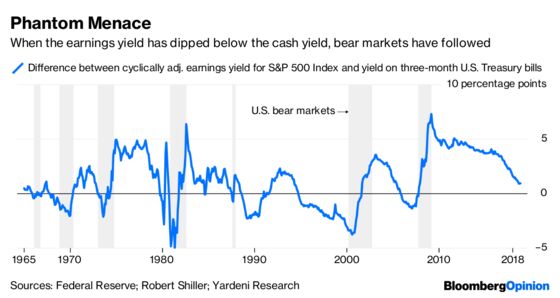
Only twice has an inversion not been followed by a bear market — a brief two-month inversion in 1984 and a longer one that stretched from 1988 to 1991. In both cases, it was corrected when interest rates declined from historic highs.
That’s a small sample size and correlation isn’t causation, but it makes intuitive sense that the earnings yield can’t remain below the cash yield for long. The earnings yield is a widely used gauge of expected stock returns. When investors expect to be better compensated from cash than from stocks, they aren’t likely to hang around the market for long.
For now, the earnings yield is higher than the cash yield, but they are moving in the wrong direction. The S&P 500’s earnings yield is 3.3 percent, while the yield on three-month T-bills is 2.3 percent. That spread of 1 percentage point is down 86 percent since March 2009 when the earnings yield peaked at 7.5 percent and the yield on T-bills was 0.2 percent. And with the Federal Reserve expected to raise short-term interest rates this month, and possibly again next year, that meager spread could quickly disappear.
There are signs that investors already have itchy feet. JPMorgan Asset Management said on Monday that it prefers cash to stocks because expected risk-adjusted returns from cash are “now well ahead of those for U.S. stocks for the first time in a decade.” In other words, a 1 percentage point premium from stocks over cash isn’t worth the trouble.
That’s not unreasonable. The S&P 500 has historically been 20 times more volatile than T-bills, as measured by annualized standard deviation. Yes, investors have been compensated for the bumps in recent years. The ratio of annual return-to-volatility for the S&P 500 has been 1.1 over the last 10 years through November, including dividends, compared with just 0.3 for T-bills. But based on current yields, it’s just the opposite. The ratio for T-bills is 2.6, compared with 0.3 for stocks.
None of this means that a bear market is imminent or that investors should dump their stocks. Timing the market is notoriously difficult. But it helps to have realistic expectations about what most likely lies ahead. For that, watch the spread between earnings and cash yields.
-- Elaine He assisted with graphics
To contact the editor responsible for this story: Daniel Niemi at dniemi1@bloomberg.net
This column does not necessarily reflect the opinion of the editorial board or Bloomberg LP and its owners.
Nir Kaissar is a Bloomberg Opinion columnist covering the markets. He is the founder of Unison Advisors, an asset management firm. He has worked as a lawyer at Sullivan & Cromwell and a consultant at Ernst & Young.
©2018 Bloomberg L.P.