Flat Yield Curves Are No Reason to Sell Stocks

(Bloomberg Opinion) -- The difference between short- and long-term U.S. government bond yields shrank to a fresh cycle low this week. The so-called yield curve that measures the gap between Treasury two- and 10-year yields is now at 25 basis points, compared with almost 80 basis points in February. This is concerning to many market participants because, at least historically, the flatter the curve is a precursor to an economic slowdown. And, a rare inverted curve has been a good predictor of recessions, as seen below. Even so, there’s nothing in the data to suggest it’s time to dump stocks.
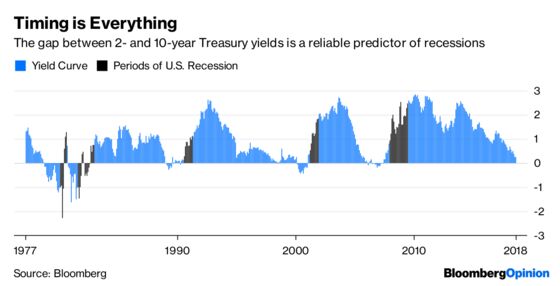
The curve inverts shortly before recessions, then steepens rapidly during and after the recession. After peak steepness, it flattens in fits and starts until it crosses zero to give advance warning of the next recession. Eyeballing the chart suggests that we are nearing the end of nearly a decade of prosperity and good stock market returns. This has induced many investors to cut back on market exposure. The table below shows the one-month S&P 500 Index return if you invest when the curve slope is at various levels. I’ve highlighted the bin that contains the current level.
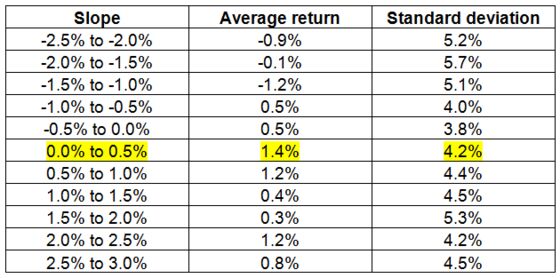
This table suggests that when the curve is only slightly upward sloping is the best time to invest in stocks, not a dangerous one. You get the best average monthly return, and a lower-than-average volatility. How can it be that with recession looming, stocks have high average return with low variance? We can get more insight by looking at a scatter plot of S&P 500 one-month returns versus yield curve slopes at the beginning of the month.
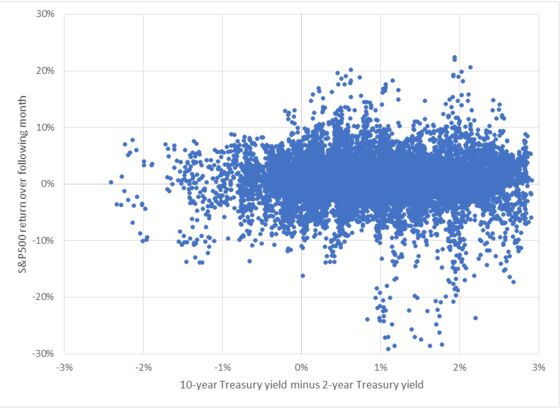
Months with losses exceeding 15 percent happen when the curve is steep. There have been few big disasters once it flattens to the point where the spread between two- and 10-year yields is less than about 0.8 percentage point. And when the curve inverts, really good months of 10 percent plus returns are scarce. The sweet spot of high potential gains with relatively limited losses has historically been when the yield curve slopes upward, but not very much.
The key is to realize that stock prices are forward-looking. The market doesn’t wait for the Federal Reserve to announce a recession before stocks fall. It doesn’t wait for businesses to cut back on expansion and long-term borrowings, while demanding short-term credit to finance bulging inventories. These are some of the reasons the curve inverts—lots of borrower demand for short-term cash to make up for slowing sales, little borrower demand for long-term funds to expand production.
When everything is going well, businesses are flush with cash and have no need for short-term borrowing, but are demanding lots of long-term cash for optimistic future plans. Sometimes the optimism pays off and stock prices continue to climb, sometimes it doesn’t and crashes ensue. By the time dark clouds are on the horizon, the market has already fallen. Getting out at that time often means getting out at the bottom. If the yield curve actually inverts by more than a few tenths of a percent, then it’s hard to lose a lot of money, because stock prices are low, but it’s also hard to make a lot, because the stock market has yet to see beyond the upcoming recession.
I don’t personally use the shape of the yield curve to time the market. Most investors should pick an equity allocation and stick to it, taking the good with the bad. Guessing increases costs and taxes, and rarely pays off in better risk-adjusted returns. If you insist on timing, I suggest sticking with proven factors like value and momentum to drive your decisions, not historical patterns based on a grand total of five data points over the last 42 years. But if you do rely on curve steepness to time the market, now seems a poor time to pull back.
To contact the editor responsible for this story: Robert Burgess at bburgess@bloomberg.net
This column does not necessarily reflect the opinion of the editorial board or Bloomberg LP and its owners.
Aaron Brown is a former Managing Director and Head of Financial Market Research at AQR Capital Management. He is the author of "The Poker Face of Wall Street." He may have a stake in the areas he writes about.
©2018 Bloomberg L.P.