Treasury Curve Shows How the Fed Is Hurting Reflation Trades
Treasury Curve Shows How the Fed Is Hurting Reflation Trades
(Bloomberg) -- The dramatic flattening of the Treasury yield curve Thursday shows how the reflation trade -- one of the hottest bets in global markets -- is starting to unravel.
A day after the Federal Reserve acknowledged that it may hike interest rates more than once in 2023, 30-year bond yields dropped as much as 16 basis points to 2.05% in the most significant move since February.
Benchmark 10-year inflation breakeven rates -- market projections for price expectations over the next decade -- slipped to the lowest since March. Commodities tumbled too, while stock rotations shook up equities.
In Friday trading, Treasuries erased earlier gains after St. Louis Fed President James Bullard said on CNBC that the monetary authority has started discussing scaling back the pace of pandemic bond-buying.
Here are four charts that illustrate the recent action:
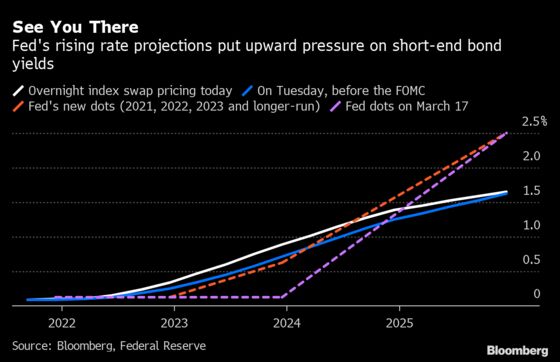
Mind the Dots
The Fed’s rate projections, known popularly as the dot plot, were the kindling for the move, by signaling that officials may not let inflation run as hot for as long as many investors had wagered.
Short-end yields still rose after the Fed decision, led by five-year Treasuries, which are typically very responsive to changes in the interest-rate outlook. Overnight index swaps that were already closer to the Fed’s estimates also nudged higher.
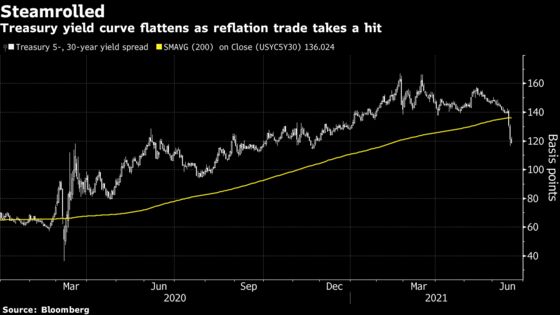
Carving the Curve
Investors often demand higher yields on long-dated bonds to compensate for the risk that higher inflation will erode returns, but with markets now pricing higher short rates to combat this, long bond yields began to fall sharply. The spread between 5- and 30-year Treasury yields tumbled below its 200-day moving average to end Thursday below where it started the year.
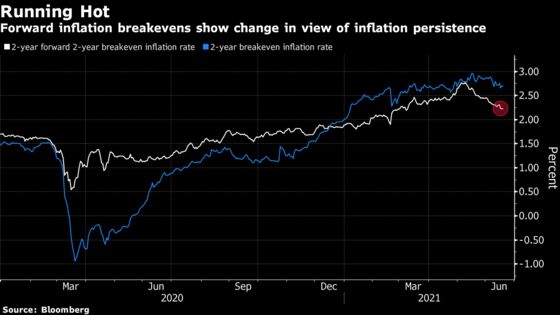
Remember It’s Transitory
Market estimates of future inflation have been easing, bringing them into sync with the Fed’s refrain that near-term gains in inflation will be “transitory.”
Two-year breakeven rates, which start in two years’ time and therefore miss the bulk of expected near-term increases, have been sliding back to levels seen in March.
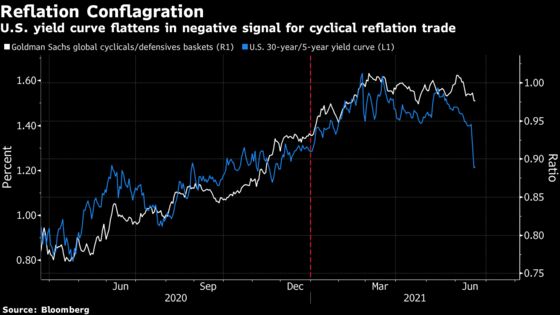
Cyclicals in Trouble
A flatter yield curve is a negative signal for cyclical shares that typically rise in economic upswings. While still ahead of their defensive peers by over 5 percentage points this year, they’ve begun to slip, according to gauges from Goldman Sachs Group Inc. Defensive stocks like healthcare and consumer staples companies may benefit more as money rotates into defensive plays.
©2021 Bloomberg L.P.