Charts Spooking Wall Street: Rate Bets, Debt Loads, Tardy Chips
These Are the Charts Spooking Wall Street Right Now
(Bloomberg) -- Halloween -- a time when terrifying things pop out from around every corner but none do you harm. That’s also a good way to describe markets at the end of 2021.
It hasn’t escaped Wall Street that 2021 has been mostly treats and no tricks, with the S&P 500 up 22% so far. But investors see plenty of dangers ahead, including corporate debt levels, lofty valuations and inflation’s persistent grip.
Here are the charts inducing nightmares on Wall Street:
Lucas Kawa, asset allocation strategist at UBS Asset Management:
“The scariest chart in finance is the divergence between the market’s short-term expectations around Federal Reserve policy and long-term real rates. The yield on the 5th Eurodollar contract -- a proxy to gauge how much the U.S. central bank might tighten policy by December 2022, in this instance -- has risen by over 30 basis points in the last month. Meanwhile, 10-year real yields have retreated to near record lows below -1.1%, down almost 30 basis points over the same span. This combination of Fed expectations rising at least 25 basis points with 10-year real yields falling a minimum of 25 basis points over a rolling one-month period is extremely rare, occurring only one other time, in February 2009.”
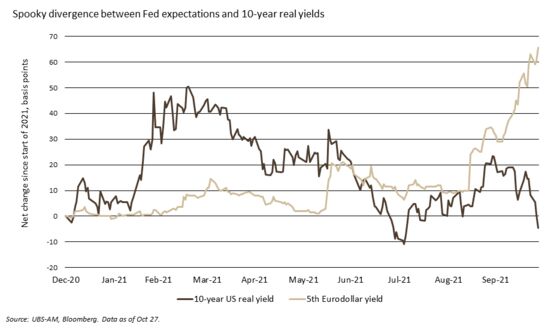
“Here are a few possible options, some of which are spookier than others: One, expectations regarding Fed tightening are too hawkish, and may be reversed by some mix of underwhelming activity data, cooling inflation, or central bank communications. Two, the fixed income market doesn’t think the economy will remain resilient following these rate hikes, which may prove to be a policy mistake and cause a growth scare. That’s not an outcome the stock market appears to be ascribing too much probability to at the moment! And three, real yields may adjust upwards to acknowledge the strong runway for both growth and inflation this cycle. This would likely be positive for our preferred procyclical relative value equity positions. However, a disorderly rise in real yields could challenge equity valuations at the index level, and the growth-oriented, expensive segments of the market in particular.”
Deepak Puri, chief investment officer at Americas at Deutsche Bank Wealth Management:
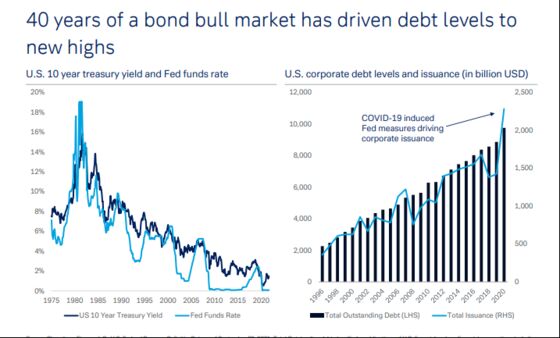
“Bond markets appear to have finally reached a turning point after 40 years of yields being driven lower by a combination of falling inflation rates and accommodative central bank policy. Taking advantage of the loosening financial conditions, corporates have steadily increased the appetite for debt over time with a considerable increase during the Covid-19 pandemic in part supported by the Federal Reserve’s stopgap measures to protect markets. As we enter a new investment landscape where inflation is returning after a long absence and central banks are becoming hawkish almost in unison, what impact will a tighter rate cycle and higher yields have on corporate profitability and the all-round health of their balance sheets?”
Katie Koch, co-head of fundamental equity within Goldman Sachs Asset Management:
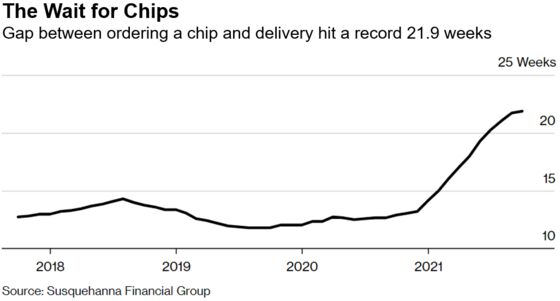
“Lead times -- the time between when a semiconductor is ordered and when it is delivered -- rose to a record of nearly 22 weeks in October, almost double pre-pandemic lead times. The pandemic has exposed the fragility of global supply chains, which is best illustrated by the global chip famine that has paralyzed industries, companies, and governments. Given how critical chips are to the advancement of technologies globally, we expect chip manufacturers to prioritize supply-chain resilience over efficiency by reshoring semiconductor production. It is worth noting that delays in chip delivery times moderated in October, which may suggest the chip shortage has peaked but there is a long road ahead for normalization.”
Ben Emons, strategist at Medley Global Advisors:
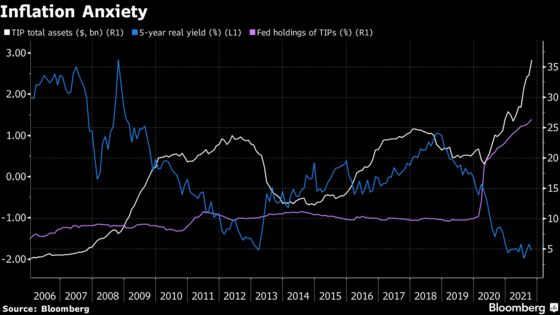
“The U.S. inflation market is subject to ‘hot money.’ The Fed’s holdings of TIPs (Treasury inflation-protected securities) and retail assets invested in the largest TIP ETF show how much anxiety there is about inflation. That is also where the risk is when inflation does moderate next year, and that could lead to a dislocation of real interest rates.”
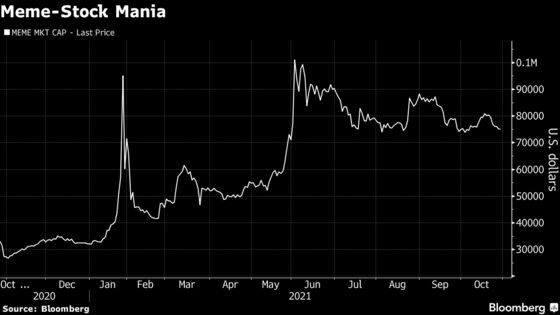
Steve Sosnick, chief strategist at Interactive Brokers:
“I’m calling this graph ‘What Happens to a Meme Deferred?’ It’s the combined market cap of 12 of the ‘OG’ meme stocks. I find it fascinating that even after they’ve faded from the market’s consciousness, they’ve been able to maintain a gain of nearly 300% year-to-date.”
“If we add in HOOD and consider it a meme stock, the total market cap exceeds the old highs.” In comparison, he said, the combined market value of Dogecoin and Shiba Inu coins exceeds $50 billion.”
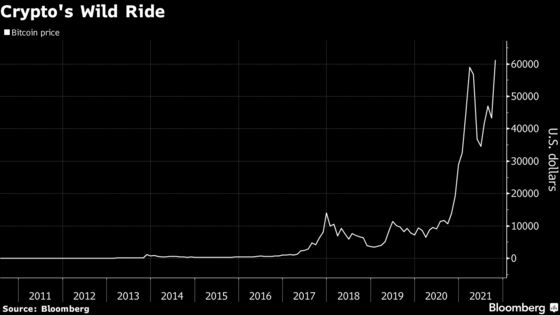
Kara Murphy, Chief Investment Officer of Kestra Investment Management:
“The volatility in Bitcoin and other cryptocurrencies is about as spooky as they come, positively dwarfing the volatility seen in more traditional asset classes. The recent upswing has attracted much attention from investors who are eager to participate in the upside, yet may be tempted to ignore the potential risks. Investors would do well to remember the tricks that come with these treats.”
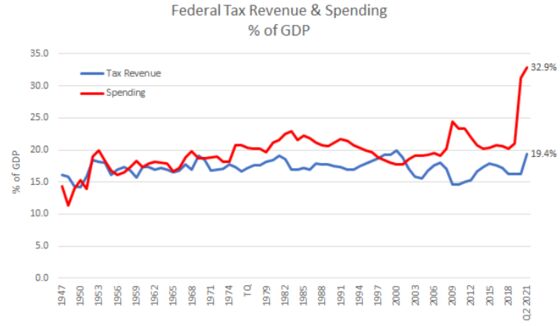
Steve Chiavarone, portfolio manager and head of multi-asset solutions at Federated Hermes:
“The 2021 scariest chart is … federal tax revenue and spending as % of GDP. Tax revenue as a percentage of GDP is currently 19.4% -- which is just a touch below an all-time high. Regardless of marginal rates or tax structure, the U.S. has never been able to generate tax revenues in excess of 20% of GDP -- a concept known as Hauser’s Law. Once tax revenues reach the 20% of GDP level, they historically have either led to more tax avoidance and/or a slowdown in economic activity that ultimately pushes revenues lower. At the same time, government spending of 32.9% of GDP is the highest since WWII, with no real signs of abating given current negotiations over further large spending bills. Together these raise the ‘spooky’ possibility of further upward pressure on inflation via profligate spending alongside tax proposals that could, at the same time, disincentivize investment and hurt both shorter- and longer-term growth prospects.”
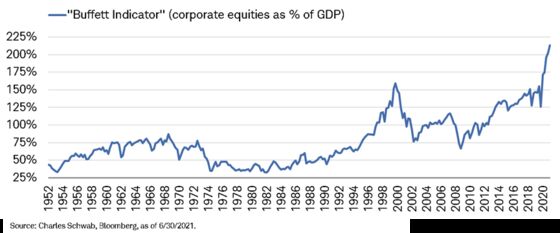
Liz Ann Sonders, Charles Schwab’s chief investment strategist:
“Never before has the stock market been valued as much as it is today relative to the size of the total economy; which suggests the stock market has never been more important as an economic driver as it is today.”
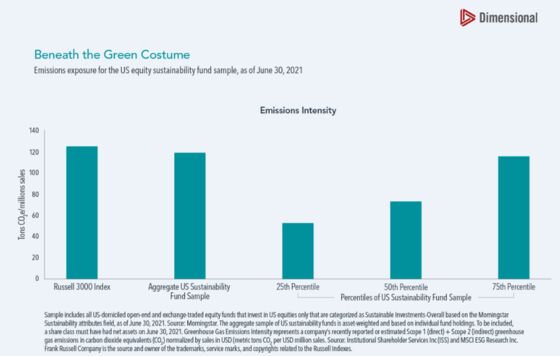
Marlena Lee, global head of investment solutions at Dimensional Fund Advisors:
“This Halloween, beware of investment funds in ‘green’ costumes. Investors searching for portfolios reflecting concerns about climate change may find ESG labels more trick than treat. One in four funds branded as ‘sustainability focused’ show less than 7% reduction in exposure to greenhouse gas (GHG) emissions intensity in comparison to the exposure of the broad market Russell 3000 index. This may be spooky for investors assuming ESG labeling to be a reliable indicator of less exposure to GHG-emitting companies.”
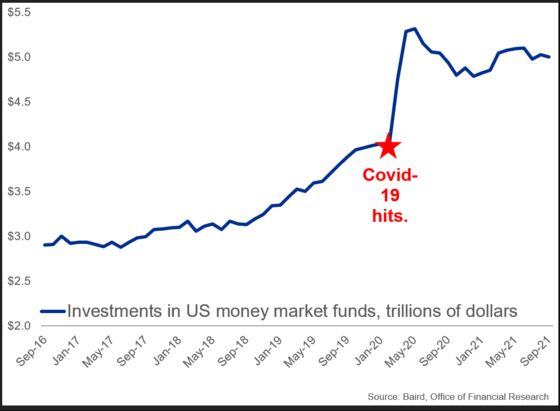
Ross Mayfield, investment strategy analyst at Baird:
“Amid the Covid-19 outbreak and subsequent stock market crash, investors piled into money market funds. However, 18 months and one historic rally later, cash on the sidelines remains elevated. Not only is cash earning next to nothing at a time when inflationary pressure is weighing on real returns, but getting back into an equity market near all-time highs is psychologically challenging (particularly one that has presented just a single -5% dip in the last year). It’s scary to think about the double-sided impact this could have on savers and investors long-term.”
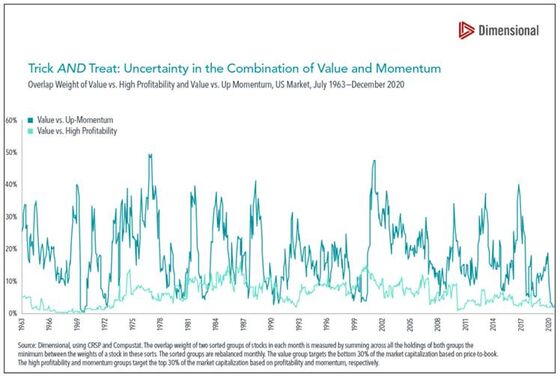
Wes Crill, head of investment strategists at Dimensional Fund Advisors:
“Investors expecting momentum strategies to diversify their value exposure may be spooked by the potential overlap between these two. Combining momentum and value strategies may inadvertently double down on one’s value tilt, a scary proposition for those wanting consistent exposure to value. Stocks with high profitability have had a more consistently low overlap with value, the two complementing each other like candy and corn.”
©2021 Bloomberg L.P.