Dark Pool Indicator Shows Stock-Dabbler Set Is Beating a Retreat
Dark Pool Indicator Shows Stock-Dabbler Set Is Beating a Retreat
(Bloomberg) -- After months spent betting on a bounce that never came, the people who drove the pandemic bull market are giving up.
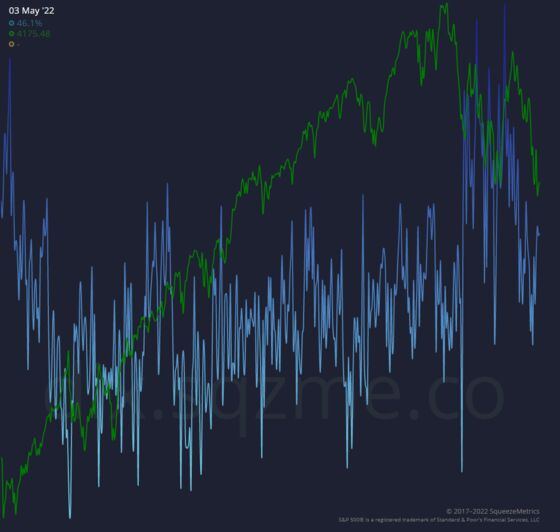
At least, that’s one way to read an esoteric indicator designed to track small-time investors, something known as the Dark Index, kept by options-analysis firm SqueezeMetrics. The gauge, which uses short sales on off-exchange venues as a proxy for market-maker volume with individuals, has sagged in recent weeks, after holding firm even as stocks sank earlier in the year.
It’s another snapshot of cratering resolve among the army of buyers that helped hoist the Nasdaq 100 more than 130% from the coronavirus bottom in March 2020. Months of frustration, culminating in the worst April for the tech gauge since 2000, are spurring a broad retreat from the bottom-fishing strategy that ruled markets for two years.
“It’s been the worst possible market, really, for somebody who was trained to buy the dip. It has not responded the way you want it to,” Matthew Zambito, founder of SqueezeMetrics, said by phone. “You see a lot of money doing what it was doing before and not getting the result that it wanted. That’s part of what you see in the dark index, no doubt.”
SqueezeMetrics’ DIX indicator is premised on the idea that on certain high-volume stock trading venues, short sales become a kind of marker for retail buying. While normally thought of as denoting directional bets that stocks will fall, the “short” tag also gets attached to regular sales by market-makers who in some cases don’t own the stocks they’re quoting prices for in places like dark pools, Zambito said. That makes them a decent proxy for what mom and pop are doing.
What has the Dark Index shown? First of all that retail interest in the market stayed strong long after the salad days of the meme stock craze that began in early 2021. While Zambito says he thought that episode would pass quickly, it didn’t, with investors buying any and all dips as the S&P 500 cruised to a 27% gain that year.
It kept advancing through January and February even as stocks started to sell off. The S&P 500 fell into a correction, and the tech-centric Nasdaq 100 lost about a fifth of its value, but the DIX hit its highest level in data going back to 2010. That suggests at-home traders had the gumption to continue wading in even as the market reversed. “That is really indicative of that retail participation and that frustration -- you can’t push a rope,” said Zambito.
But over the past two weeks, as equities again retested this year’s lows, the DIX has weakened “substantially,” Zambito said. Its current reading is hovering around 46% -- that’s the percentage of dollar volume that’s been flagged as short across the S&P 500. It had reached 54.7% in March.
It’s not that all of the mania has been wrung out, just that there’s been a tapering off of the enthusiasm, Zambito says. He chalks it up to a few factors: inflation, uncertainty over Federal Reserve policy and the war in Ukraine among them -- any of which may have persuaded retail investors that dip-buying isn’t the unshakable play they once thought.
That could change should the selloff in bonds abate. But, “very likely some of that dip-buying has been exhausted because we are at the same level that we were when we bottomed on the S&P before, and there’s not the same fervor at all,” he said. “That marginal desire to get into stocks, whether because of internal or external constraints, it’s definitely not really there anymore.”
©2022 Bloomberg L.P.