These Are the Crypto Charts to Watch as Bitcoin Drops Below $60,000
These Are the Crypto Charts to Watch as Bitcoin Drops Below $60,000
(Bloomberg) -- Bitcoin dropped further below $60,000 to its lowest level in about three weeks amid a broader decline in cryptocurrencies, as concerns about U.S. taxation and China’s continued crackdown swirled.
The largest cryptocurrency was down about 2.5% to $59,000 as of 11:23 a.m. in Hong Kong on Wednesday, retreating for a fourth straight day. Ether fell 3.4% to $4,110 to its lowest level since Oct. 28. The top tokens were all nursing declines of at least 10% over the past seven days.
“This minor pullback creates an attractive risk/reward to buy dips for a push higher in the weeks to come,” according to a Fundstrat technical strategy report Tuesday. “Downside targets should materialize this week,” with support for Bitcoin coming at key levels of $59,862 or $57,371, the report said.
The crypto complex has performed well this year overall, but concerns about tax provisions in U.S. infrastructure legislation and a continued crackdown by China helped sap momentum from what had been a strong run during the past couple of months.
Here are some charts showing what’s going on in crypto now:
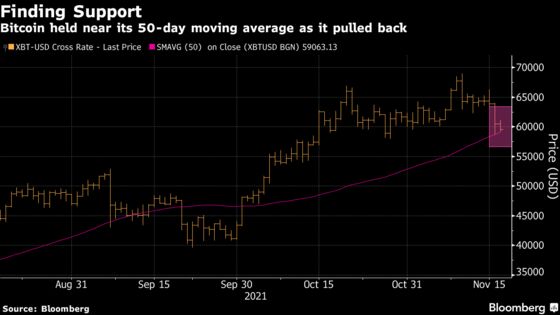
50-Day Average
Bitcoin sat near its 50-day moving average during its drop on Tuesday, which offered support just below the round number of $60,000 on Tuesday. The technical indicator is being tested again Wednesday.
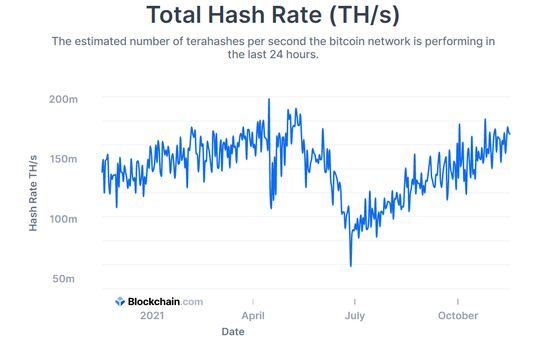
Hashing It Out
The hash rate, which measures the computing power of the Bitcoin network, has largely recovered since its mid-year swoon as China renewed its crackdown against the crypto industry.
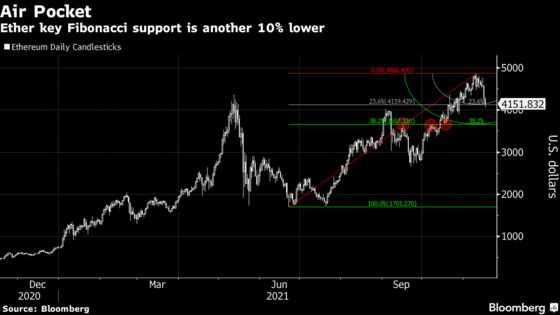
Mind the Gap
Ether’s Fibonacci setup, a series of key technical levels, shows it’s at risk for a further slide.
©2021 Bloomberg L.P.