ADVERTISEMENT
Five Charts That Show How the U.S. Ran Out of Homes for Sale
Five Charts That Show How the U.S. Ran Out of Homes for Sale
09 Jun 2021, 07:21 AM IST 

(Bloomberg) -- On the latest episode of the Odd Lots podcast, we spoke with Ali Wolf, the chief economist at Zonda, a housing data and research firm.
The topic was simple: How did the U.S. get into this situation where we were out of homes to buy? Whether it’s new homes or existing inventory, would-be buyers have become incredibly frustrated over the last several months.
So to help illustrate Ali’s point, she sent over five slides on the state of the market.
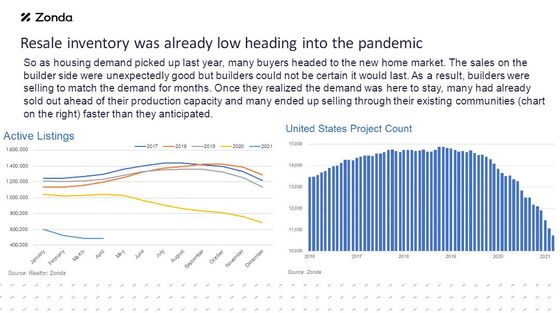
To start, going into the pandemic, we were already seeing a slide in inventory.
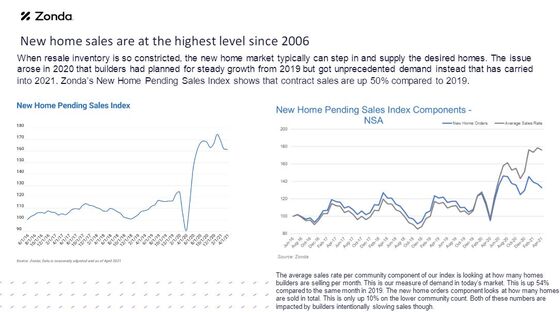
New home sales are incredibly stretched. Far beyond what builders are normally used to delivering.
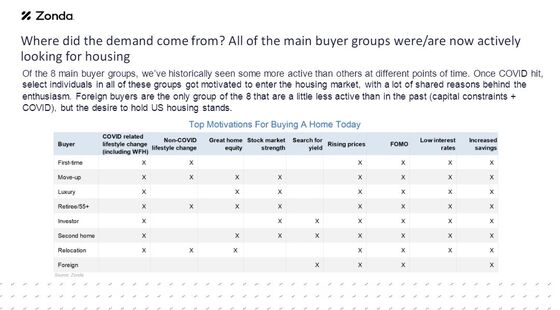
The nature of buyers has changed dramatically, with big increases in relocation buyers. But basically, all different types of groups are buying for all different reasons.
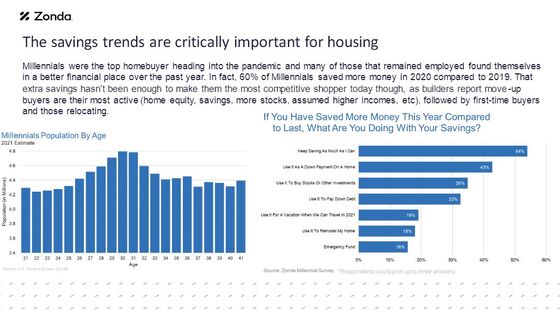
More and more people are in a position where they have the savings to buy a home. A number of people, including many millennials, have found themselves wealthier than they were per-crisis.
Amid all this, builders are dealing with numerous challenges, including shortages of labor, land, and supplies, as well as government services (permitting authorities can only move so fast)
©2021 Bloomberg L.P.