Even Before Covid 2,600 People a Week Were Leaving New York City
Even Before Covid 2,600 People a Week Were Leaving New York City
(Bloomberg) -- Whether it’s wealthy people fleeing to their second homes or college students forced to move back in with their parents, the coronavirus has set off a great migration in the U.S. this year. But in many cases, it’s just amplifying trends that were already there.
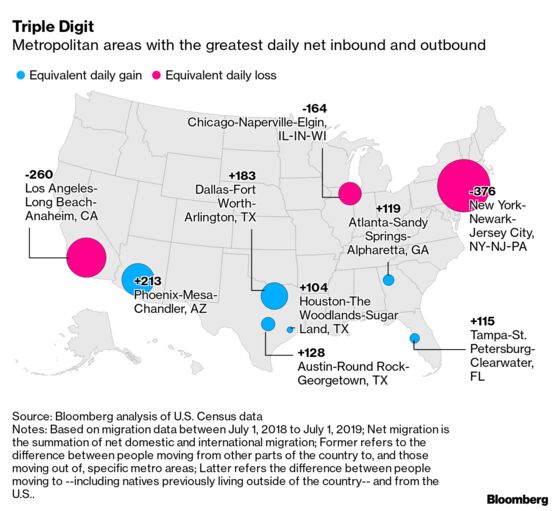
New York City, for example, was losing 376 residents per day to domestic migration in 2019 -- an increase of more than 100 per day from the previous year -- before it became the epicenter of the country’s virus outbreak in March this year, according to the U.S. Census Bureau’s latest survey of population shifts.
“New York’s population decline has been building up before Covid,” said Justin Hollander, a professor of urban and environmental policy and planning at Tufts University in Massachusetts. “It will certainly accelerate as preferences for lower-density environments drives populations.”
The shrinking of New York would be significantly faster without international arrivals. Last year, almost 60,000 cross-border migrants moved there (only Miami had more) while 200,000 residents left.
Los Angeles and Chicago were among other cities to see daily departures in triple digits last year. Both have been losing population since 2017. That’s at least somewhat at odds with a widespread Covid narrative that portrays cities booming at the expense of small towns until the pandemic struck.
Hollander points out that longer-term trends predating the pandemic show no sign of ebbing, including the lure of Sun Belt cities in the south and southwest and the shift away from urban centers among retirees.
New York has ranked as the city with the highest population in every census count since the late 1700s, and it’s likely to keep that top ranking for decades to come. Elsewhere in the top 10, there’s been plenty of churn.
Cities shrink when deaths outpace births and/or residents leave. While the pandemic probably is triggering a change of pace, it’s less likely to shift urban areas away from whatever trajectory -- dynamic or declining -- they were on before.
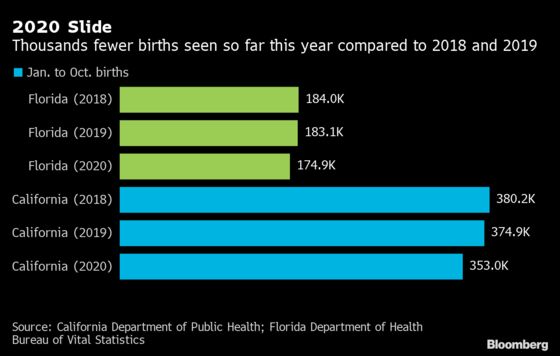
Some effects of the pandemic may stretch from coast to coast. For example, Philip Cohen -- a sociology professor at the University of Maryland -- points to early indications of a coming decline in births. Monthly data in California and Florida suggests they’re trailing prior years.
The six U.S. cities that saw more than 100 people a day arriving in 2019 were all in the south, with Phoenix and Dallas in the lead. In percentage terms, Austin was the fastest-growing among the largest 100 metro areas with a population increase of 2.84%.
All of the 100 biggest cities saw a net addition from international migration, with the exception of McAllen, Texas; Las Vegas and Boise City, Idaho. The latter two, however, featured among the top 10 for domestic migration.
Tax Base
City governments, focused on their ability to raise revenue, have to take into account the incomes of those who leave as well as their overall number. That’s potentially another concern for New York, where residents who earn $100,000 or more make up 80% of the income-tax base, according to the think tank Manhattan Institute.
A recent survey found that high-earning New Yorkers reported a slump in their quality of life since the onset of the pandemic. There, too, something may have been afoot already.
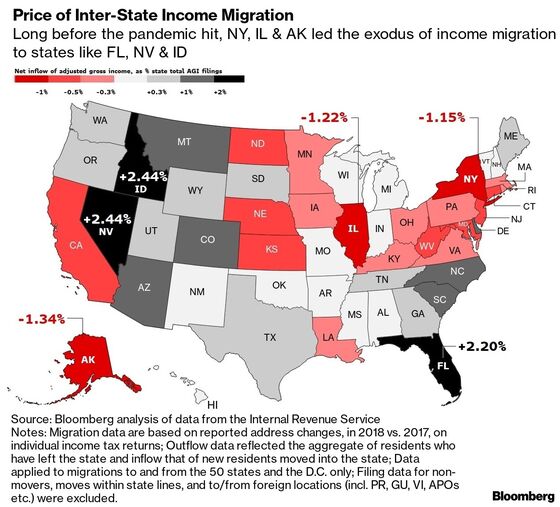
Bloomberg analysis of tax-returns by people who migrated between states suggests that New York state lost a total of $9.6 billion in resident earnings in the filing years of 2016 and 2017. The data shows that for every dollar of income brought into the state by a new arrival, $1.80 was headed the other way.
For more data on the population change in the 100 largest U.S. metropolitan areas driven by migration, click here. For data on changes driven by births and deaths, click here.
| Methodology: Bloomberg ranked the 100 largest U.S. metropolitan areas based on their net migration data, between July 1, 2018 to July 1, 2019, as a percentage of total base population as of July 2018. Net domestic migration refers to the difference between people moving from other parts of the country to, and those moving out of, specific metro areas; Net international migration, including natives previously living outside of the country, refers the difference between people moving to and from the U.S. |
|---|
©2020 Bloomberg L.P.