Death Cross Is Staring Down S&P 500 Bulls After Terrible Week
Death Cross Is Staring Down S&P 500 Bulls After Terrible Week
(Bloomberg) -- After getting crucified this week, a popular technical measure is offering a hint at more pain to come for U.S. stocks.
The S&P 500 closed down 2.3 percent on Friday, pushing the 50-day moving average below the 200-day moving average in a bearish technical pattern known as a "death cross."
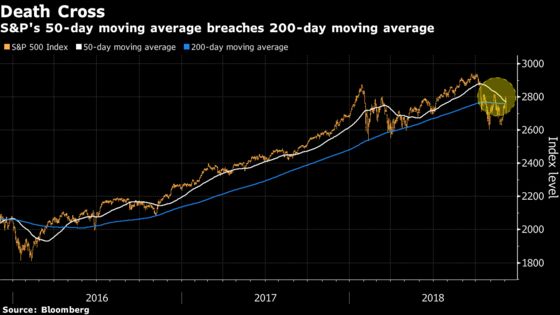
“It’s a bad short-term indicator because each of the last three times we’ve seen one, the market has experienced a sharp rally within a couple of days,” said Matt Maley, equity strategist at Miller Tabak & Co. “However, each time, the market also rolled back over within one to three months before it finally became washed out."
The last incidence in which the 50-day crossed below the longer-term average -- January 11, 2016 -- may embolden both bulls and bears. The S&P 500 fell 4.9 percent from that level before bottoming one month later. The benchmark gauge ended up rising 16.4 percent from the time of the death cross until year-end.
To contact the reporters on this story: Luke Kawa in New York at lkawa@bloomberg.net;Vildana Hajric in New York at vhajric1@bloomberg.net
To contact the editors responsible for this story: Jeremy Herron at jherron8@bloomberg.net, Dave Liedtka, Brendan Walsh
©2018 Bloomberg L.P.