Analysis of U.S. Virus Statistics Hampered by Lag, Low Testing
Analysis of U.S. Virus Statistics Hampered by Lag, Low Testing
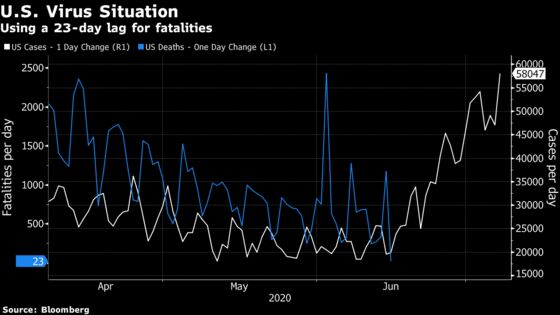
(Bloomberg) -- If the surge in U.S. case numbers should result in increasing deaths, why haven’t we seen it by now?
Market bulls point out that the lag between the April peaks in U.S. daily cases and deaths was only five days. The lag was six days in Italy, eight days in Spain and 11 days in the U.K. We’re way past those spans now in the Sun Belt states where cases have been climbing, which is why several readers rejected my proposition this week that it was premature to relax around the trend in the U.S. death numbers.
They also observe that the beginning of the breakout in case numbers was earlier than the June 25 record that I had cited. Using Bloomberg data, June 19 was the first major jump in numbers -- 24% above the previous day’s total and 17% higher than anything seen in the previous six weeks.
That would suggest that any resultant rise in deaths should have been seen by the weekend just passed, at the latest.
But this ignores that we know the early empirical data were deeply flawed because in April most people weren’t being tested until they were seriously ill. As more proactive testing is enacted, the empirical lag between cases and fatalities should extend. As hospital treatments get better, it should grow further.
This isn’t to conclude that fatalities necessarily will surge (I have no virus/health expertise). Dr. Anthony Fauci said the average age of U.S. coronavirus patients has dropped by 15 years compared with a few months ago and we know that age is a key factor in vulnerability, so that’s encouraging. It’s just to posit that it would be extremely hasty for bulls to declare victory already, especially as case numbers are still accelerating (fresh one-day record on Tuesday).
The perspective of those who are bearish the market based on virus concerns is that the U.S. running mortality rate (total confirmed fatalities over total confirmed cases) is dropping more slowly than the infection is spreading, resulting in a worsening projection for deaths in several weeks time. As an example:
July 7:
- Running mortality rate = 4.391%
- 7-day avg case count: 51,332
- 4.391% * 51,332 = 2,254
To see the trend:
- June 30: 4.836% * 41,069 = 1,986
- June 23: 5.165% * 29,891 = 1,544
- June 16: 5.47% * 22,615 = 1,237
Everyone would acknowledge this is an over-simplified forecasting method -- the final tallies should, thankfully, come in much lower.
But the trend is worrying regardless. And pessimists have one extra concern -- if case numbers keep rising at such a pace, then hospital systems will eventually become overwhelmed and the running mortality rate may actually start rising again.
NOTE: All numbers and dates are based on Bloomberg data; the slight discrepancy in calculated forecasts/lags based on data source doesn’t change the underlying analysis but does perhaps further warrant caution toward jumping prematurely to any conclusion.
NOTE: Mark Cudmore is a macro strategist and the global managing editor of Bloomberg’s Markets Live team. The observations he makes are his own and not intended as investment advice. For markets analysis, see the MLIV blog
©2020 Bloomberg L.P.