The Inverted Yield Curve Deserves Better Scrutiny
The Inverted Yield Curve Deserves Better Scrutiny
(Bloomberg Opinion) -- If you want to know what’s likely to happen next, should you take your cue from history? It’s a fact that every U.S. recession since the 1960s was preceded by a year or so by an inversion of the Treasury yield curve, which happens when long-term rates drop below those of shorter-dated bonds.
On March 22, the yield on the benchmark 10-year Treasury note fell to 2.42 percent, dropping below rates on three-month bills for the first time since July 2007. The logical conclusion is that if a recession followed the past six inversions, the next one must be on the way.
That’s not a fact, but it’s a belief that has permeated the investment community, with many market commentators citing prior inversions to confirm their conclusion that a recession must now be imminent. This classic example of “data mining” has led market participants to compromise their objectivity by keying in on data that underscore and support pre-existing beliefs without testing whether current underlying economics could lead to alternative explanations. That’s the danger we now face.
Objectivity should lead to questions about why the yield curve inverted, because an inversion caused by rising front-end rates is very different economically to one driven by falling back-end rates.
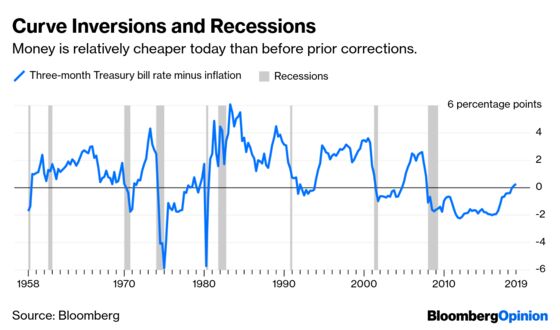
The key difference is in the price of money. Recent inversions have been driven by front-end rates rising as the Federal Reserve rapidly tightened monetary policy to fight inflation and counter policy that might have been too stimulative for too long. This caused front-end rates to rise well above inflation, making money expensive. Simplistically, overnight lending to a credible party is a near riskless activity, which should not return much more than inflation, so a large premium in excess of inflation means money is expensive. In historic inversions, money became very expensive, which naturally caused a drop in economic activity. We can call this a bear inversion.
But this time around, rather than an aggressive Fed raising rates to curtail inflation — as prices appear to be in check — the inversion has been caused by the return of a dovish and accommodative central bank, which has pushed yields down across the curve, with those on longer-dated bonds dropping more. You could term this a bull inversion.
Crucially, at no time during the Fed’s current tightening cycle — when it raised rates nine times — or after the inversion did front-end rates jump well above inflation, which would have made money expensive. Rather, a fundamental difference between the latest inversion and those of the past is that money remains fairly priced. Today, the yield on three-month Treasury bills is just 30 basis points above core inflation. By contrast, prior to every recession since 1960 the three-month yield exceeded inflation by almost 200 basis points. Money is relatively cheaper today than before prior corrections.
So we are sailing in unchartered waters with no historical examples to help indicate how the current situation might play out. Perhaps it’s wrong to place so much weight on the current shape of the Treasury curve, which likely has been distorted by years of extremely accommodative monetary policy. It might be prudent to look at other markets as a more reliable barometer of economic health.
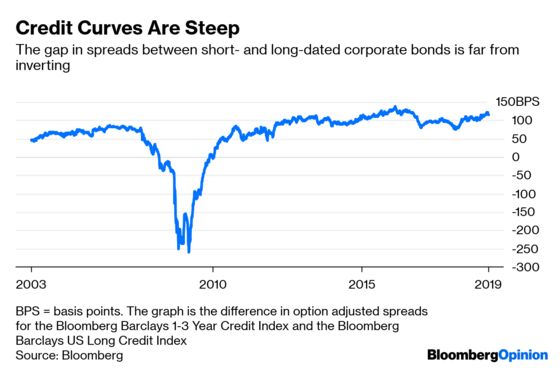
Credit curves, for example, tell a very different story. The difference in the credit spread between short- and long-dated U.S. corporate bonds is around 120 basis points, well above its average of 80 basis points since 2000. That spread difference last inverted in March 2008, about five months before the financial crisis.
Nor are equity markets signaling imminent recession. On the contrary, they are forecasting growth. The upside implied by calls versus the downside implied by puts on the S&P 500 Index are trading near average levels, while calls and puts for international equities are trading above average levels.
So what should investors conclude from the inversion of the three-month to 10-year part of the Treasury yield curve? While the abnormal shape of the Treasury curve demands attention, years of monetary easing have created a unique set of circumstances, making it tough to conclude with any certainty that inversion inevitably means pending recession.
Sometimes, history tells us a lot to help us predict the future; sometimes it tells us little. In this instance, it might not be prudent to give too much weight to recent experiences.
To contact the editor responsible for this story: Robert Burgess at bburgess@bloomberg.net
This column does not necessarily reflect the opinion of the editorial board or Bloomberg LP and its owners.
Myron Scholes, who received the Nobel Prize in Economic Sciences in 1997, is the chief investment strategist at Janus Henderson Investors.
Ash Alankar is the global head of asset allocation and risk management at Janus Henderson Investors.
©2019 Bloomberg L.P.