One Chart on Crisis Anniversary Shows How Market Bulls Won Big
One Chart on Crisis Anniversary Shows How Market Bulls Won Big
(Bloomberg) -- Eleven years later, bulls have had their revenge.
On Aug. 9, 2007, BNP Paribas SA froze three funds exposed to U.S. subprime mortgages, signaling a series of calamitous events culminating in the collapse of the housing bubble, the bankruptcy of Lehman Brothers -- and the very seizure of the global financial system.
Fast-forward to the summer of 2018: the market fightback since then remains staggering.
The S&P 500 Index is within a whisker of its record high, the global credit supercycle is powering ahead, and fear has gone missing from U.S. Treasuries and stocks, with volatility gauges tumbling back toward historic lows.
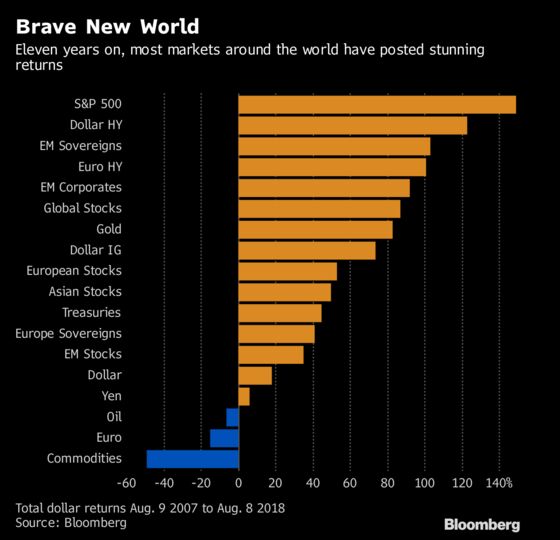
While broad commodities, European periphery stocks and euro-area bank shares have yet to recover to pre-crisis norms, monetary intervention and a spirited upswing in the business cycle have reflated prices around the world.
Since the August 2007 meltdown, the S&P 500 has delivered a total return just shy of 150 percent, euro area and U.S. junk bonds have pulled off a two-fold gain, while emerging markets remain big winners, belying this year’s rollercoaster.
Lest you forget: price growth in the real economy -- consumer inflation to wages -- continues to undershoot the market boom.
"One of the great ironies about financial markets in the period since is that returns in major global financial assets have been incredibly healthy notwithstanding a few outliers," Deutsche Bank AG credit strategist Jim Reid wrote in a note, heralding the asset landscape 11 years on.
--With assistance from Natasha Doff.
To contact the reporter on this story: Sid Verma in London at sverma100@bloomberg.net
To contact the editors responsible for this story: Samuel Potter at spotter33@bloomberg.net, Natasha Doff, Yakob Peterseil
©2018 Bloomberg L.P.