Where's the Bottom? Valuation Cases for an Unstable Stock Market
S&P 500 Index fallen out of a range of technical support, including its 200-day moving average.
.jpg?auto=format%2Ccompress&w=200)
(Bloomberg) -- How low must stocks go to reach levels where investors get a grip on their hair-trigger selling? It’s the question on everyone’s lips.
One after another, levels that promised support have failed amid the wild swings that have engulfed equities since October. While the S&P 500 Index bounced Monday within points of its 2018 low, it’s fallen out of a range of technical support, including its 200-day moving average.
Try as they may, investors just can’t decide if shares are cheap enough to own. So many things make the calculation hard, from U.S.-China trade to rising interest rates and worries about a recession.
“In the short run, these valuations are attractive. Longer run, it’s a little tougher to see,” Peter Jankovskis, co-chief investment officer at Oakbrook Investments, said by phone. “At some point the economy is going to slow. We will have higher interest rates to go along with that, and that’s going to hurt valuations.”
So where’s the floor? Below are four views that tackle the question from the perspective of valuation, using corporate earnings, monetary policy and economic fundamentals. Some show the bottom is a long way off, others that stocks are a screaming buy.
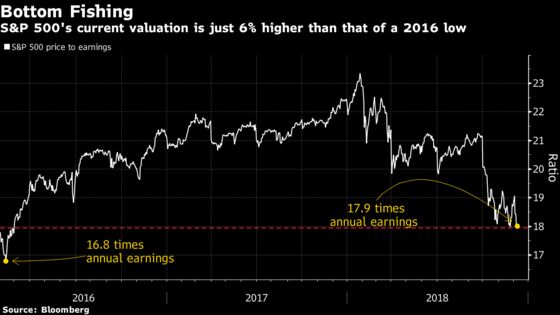
2016’s Case Study
Going by the simplest measure, price-to-earnings ratios at the bottom of the last sell-off, the end could be soon. At the start of 2016, concern about an earnings contraction and weakening growth overseas sent the S&P 500 down 10 percent and its valuation to 16.8 times annual earnings -- about 6 percent lower than its level now. Back then, those multiples were seen as too cheap to pass up, and stocks rallied 15 percent over the next four months.
Fed Model
The altitude of bond yields is an issue for equity investors in the latest sell-off. Not only do higher interest rates boost the cost of doing business for companies, they also make stocks less attractive by offering competing returns. One bearish case holds that as the Federal Reserve raises rates, part of the valuation premium embedded in stocks due to a decade of loosening monetary policy will need to be deflated.
While the relationship between bond yields and corporate earnings has shifted over history, a version of something known as the Fed Model is occasionally examined for hints on where the market may find a floor.
Consider 2015, a year when the Fed started this hiking cycle and fears over higher rates sent stocks into a correction. At the market’s trough in August, the S&P 500’s earnings yield -- a loose proxy for how much equities “pay” shareholders -- was 3.9 percentage points above 10-year Treasury yields. Now the spread is 2.7 points.
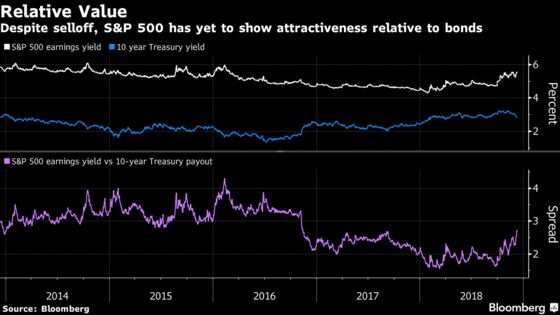
A wider gap means equities are cheaper versus bonds, and going back to that big of a spread would imply a 17 percent drop in the S&P 500, everything else equal, data compiled by Bloomberg showed.
“Right now I feel like everyone is so pessimistic and just so ‘glass is half empty’ that I would expect you could see the yield spread get a lot wider before we hit a bottom,” Chris Zaccarelli, chief investment officer at the Independent Advisor Alliance, said by phone. “On the other hand, I already think the sell-off has gone too far, so who’s to say?”
Growth Model
The stock market is not all about the economy. But lately it’s been tough to escape the sense that investors, in their collective wisdom, have turned sour on prospects for growth. Far too sour, according to Goldman Sachs, which says a bottom should already be forming.
The S&P 500’s return over the last 12 months has turned negative for the first time since 2016, something that has historically corresponded to particularly grim readings in headline economic indicators. In the Institute for Supply Management’s manufacturing index, it’s consistent with a reading of 50, or stagnant growth, Goldman data showed. By contrast, the factory gauge rose to 59.3 last month, a sign of healthy expansion.
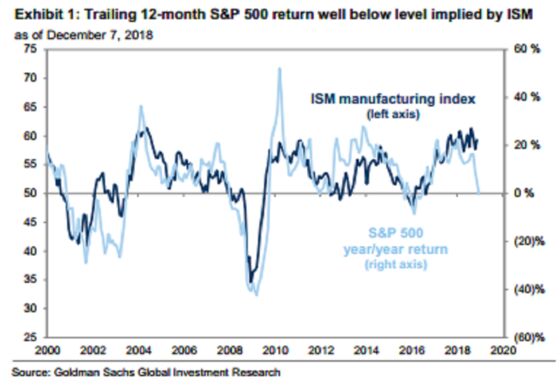
Growth will decelerate next year, but still far above zero as implied by the equity market, according to Goldman strategists led by David Kostin. The firm’s economists forecast a 2.5 percent increase in next year’s gross domestic product.
“Recent equity market performance implies a more dramatic slowdown than our baseline,” Kostin wrote in a note published late Friday. “Accordingly, we believe there is short-term upside to the S&P 500.”
PEG Ratio
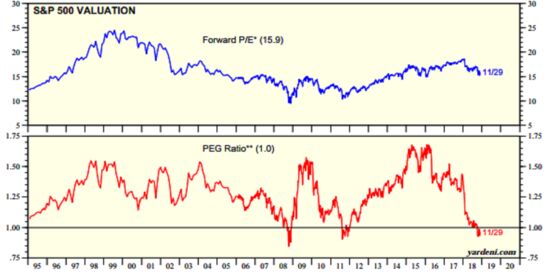
Using a valuation model that incorporates prices and profit growth, stocks are actually rare bargains now. It’s the PEG ratio, which, if you believe analyst earnings estimates for next year, is sitting at 1, meaning the market’s P/E and the growth rate in earnings are equal. According to Yardeni Research Inc., the PEG is lower than any time since the 1990s, except for the 2011 sovereign debt crisis and the 2008 financial meltdown.
Certainly, one could argue that the recent carnage is evidence investors don’t trust next year’s forecasts. But to Andrew Slimmon, senior portfolio manager at Morgan Stanley Investment Management, a lot of the skepticism has been reflected in share prices.
“The valuations are at such levels that a lot of these revisions have been built into the stock market,” Slimmon said in a phone interview. “Value stocks could have a significant rebound if we don’t have a recession.”
--With assistance from Elena Popina and Vildana Hajric.
To contact the reporters on this story: Lu Wang in New York at lwang8@bloomberg.net;Sarah Ponczek in New York at sponczek2@bloomberg.net
To contact the editors responsible for this story: Courtney Dentch at cdentch1@bloomberg.net, Chris Nagi, Richard Richtmyer
©2018 Bloomberg L.P.