What Markets Looked Like Just Ahead of Last Two Stock Downturns
What Markets Looked Like Just Before the Last Two Stock Crashes
(Bloomberg) -- Stocks are up in 16 of the last 20 sessions, the S&P 500 has jumped 8% in seven weeks and Peloton Interactive just closed above its IPO price. Nervous investors want to know: is this the top?
They’re worried the good times can’t last when stocks surge past all-time highs, even though history suggests there’s no particular danger in betting on fresh records.
But while equity market peaks often share similarities -- high valuations, low volatility, stretched chart patterns and seemingly easy credit -- no two are perfect twins. Here’s how the current cross-asset landscape compares with January and September 2018, two prior S&P 500 record levels that gave way to pain.
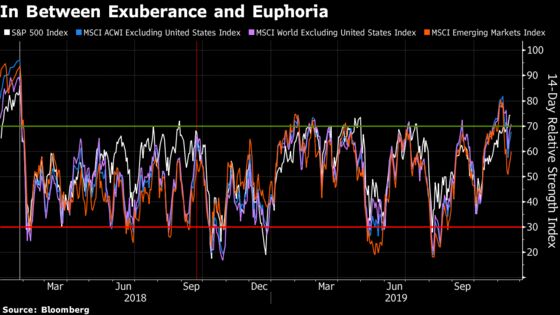
Momentum
Euphoria was the buzzword in early 2018, with traders celebrating synchronized global growth and recently-passed U.S. tax cuts. Their elation drove a variety of global bourses well into overbought territory, according to the 14-day relative strength index. Conversely, no such alarm bells rang at another peak that lives in infamy, the September 2018 high.
Flip to today and the S&P 500 Index is the most overbought since January 2018, with global developed-market stocks outside the U.S. also posting an RSI reading above 70. So: the persistence of up days is reminiscent of the first peak of 2018, while the relatively slow grind higher hearkens to the second.
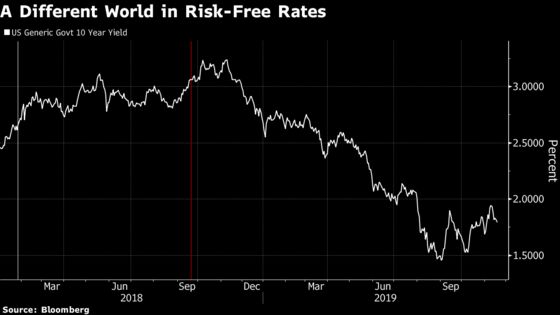
Bonds
The briskness of the selloff in U.S. Treasuries played a role in forming the 2018 market tops. January’s non-farms jobs report raised concerns about overheating, while fears of a Fed policy error were front of mind amid the 2018 end-of-year risk rout. The 10-year yield has fallen roughly 125 basis points since September 2018. While the reversal in Treasury yields off their 2019 lows has included the same rapid moves higher, these have served more to reinforce rather than undermine risk appetite. And more recently, U.S. stocks have shown the ability to grind higher no matter what the bond market is doing. Whatever optimism is baked into stocks is much more tempered in sovereign debt.
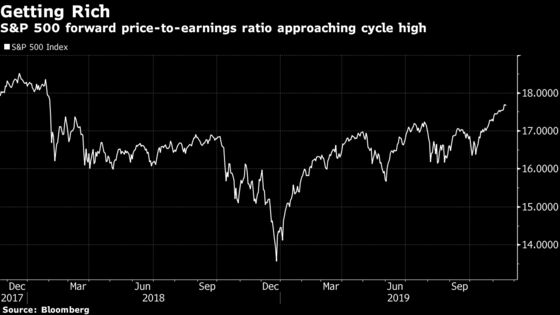
Valuation
A 12-month forward price-to-earnings ratio above 18.5 marked the cycle high in late 2017 just before the January 2018 melt-up got underway. In another sign of how little warning came before the September 2018 peak, valuations weren’t flashing alerts then, having been higher in that February, March, and August. At 17.7 times earnings, the current forward ratio is the richest since the aftermath of the January 2018 peak.
Volatility
Realized swings in stocks bear a much closer resemblance to the September 2018 high than January’s, a reminder that some intermediate tops happen with a bang while others fade with more of a whimper. Ten-day volatility for the S&P 500 recently hit its lowest level since 2017. By contrast, the last gasp of January 2018’s advance included a relatively unusual combination of stocks and volatility rising together.
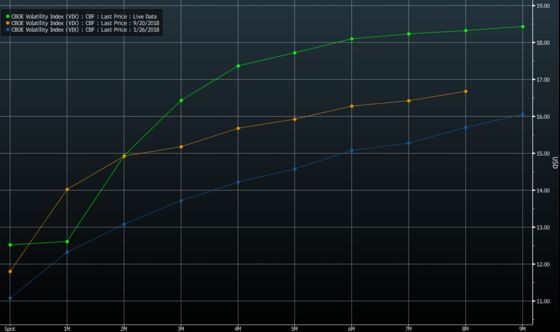
But even though realized gyrations have been smaller, the Cboe Volatility Index, a gauge of the 30-day implied volatility in the S&P 500, is higher now than it was at either of the prior peaks. That’s an indication that market participants may not be overly complacent.
When stocks are at highs, volatility futures curves are usually indicating that near-term market fear is minimal. These three occasions all adhere to that rule of thumb. What differs is the degree of uncertainty about how long the tranquility will last. The upward slope at the front of the VIX futures curve, known to traders as contango, is much steeper now than in January or September 2018, and is poised to remain steep even after an imminent roll of the futures contracts.
The absence of contango almost two years ago was used as a warning sign by some investors that market hiccups could get painful, given the build-up of assets in short-volatility products that would face extra headwinds if the curve flipped, into a state known as backwardation.
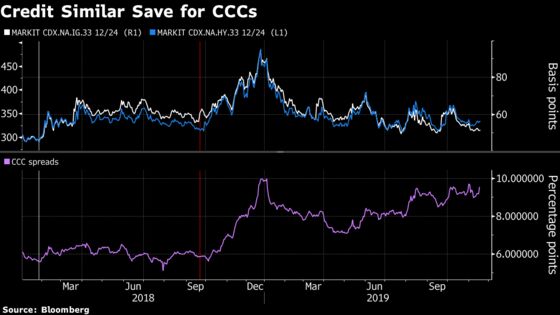
Credit
From 30,000 feet, conditions in credit markets are very similar to the January and September local highs, judging by credit default swap spreads on investment and high-yield U.S. bonds. The one glaring difference is how the riskiest debt is doing. Spreads on CCC-rate bonds have failed to pare much of the damage from last year’s selloff, and remain close to 10 percentage points over Treasuries. While the travails of select companies -- mostly located in the energy sector -- have failed to make even a dent in sentiment, it’s a reminder that the rising risk tide isn’t lifting all boats.
To contact the reporter on this story: Luke Kawa in New York at lkawa@bloomberg.net
To contact the editors responsible for this story: Jeremy Herron at jherron8@bloomberg.net, Chris Nagi
©2019 Bloomberg L.P.