Fear Gauge’s 58% Surge Leaves Stock Strategists Asking What Next
the Cboe Volatility Index climbed as high as 18.38 on Monday, a level not reached since June 28.

(Bloomberg) -- The VIX is stirring.
After spending most of the summer below 15, the Cboe Volatility Index climbed as high as 18.38 on Monday, a level not reached since June 28. The so-called fear gauge climbed as much as 58 percent in the past three days, and its futures curve has inverted in each of the past two sessions, which suggests traders anticipate more near-term turbulence in stocks. That has strategists talking about what comes next.
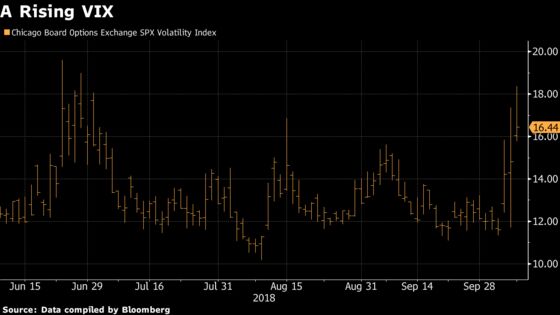
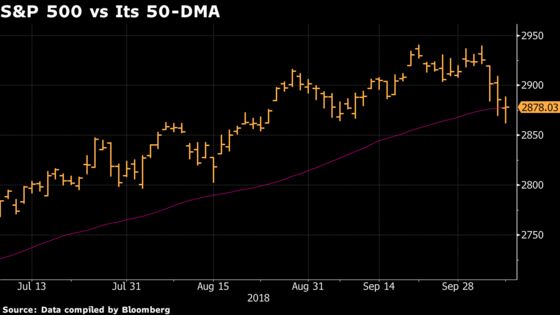
“The VIX level I’ve been watching has been 18-20, as an area where we might see a local low and possible denouement for S&P selling,” Cantor Fitzgerald LP Chief Market Strategist Peter Cecchini said, though he added it’s a bit early to call a low despite decent support of around 2,865 on the S&P 500 Index. (Monday’s range has been about 2,862 to 2,888.) “I would expect that we have a bit more volatility in store,” he added, “at least in large caps.”
A move above 18.66 would be key, according to Todd Salamone of Schaeffer’s Investment Research. That’s half of the closing high for 2018, and reaching that territory could indicate volatility will rise even more in coming weeks, he wrote in a note. The gauge retreated below 16 Monday afternoon as stocks staged a late-session recovery. Over the course of the current bull market, the VIX has averaged a bit less than 18.
Seasonality may also be coming into play. The VIX often stays lower throughout the summer, only to peak in September through November. Some people, however, are looking at the measure for what it indicates about the stocks themselves.
“I’m more focused on the three-month curve,” Dave Lutz of Jonestrading Institutional Services LLC wrote in an email. A VIX curve in backwardation -- downward sloping -- “tends to be a signal of oversold equity conditions.”
Evercore ISI’s head of technical analysis, Rich Ross, also sees potential for an upward move in stocks and a corresponding downward one in the VIX.
“Moves which fail to hold above well-defined resistance on an intraday basis often coincide with the end of that move and a key inflection point in the opposite direction,” Ross said. Stocks are oversold and sitting on support levels, so there’s potential for them to rise while volatility drops, he added.
Bear in mind all this is happening on Columbus Day, so it may take a while longer to determine just how much significance to assign the VIX’s move above 18.
“Making panic sales in a thin, low-volume holiday tape with the VIX at the high end of a six-month range and the bond market closed is typically not a strong play,” Evercore’s Ross cautioned. “So I wouldn’t do that.”
To contact the reporter on this story: Joanna Ossinger in New York at jossinger@bloomberg.net
To contact the editors responsible for this story: Chris Nagi at chrisnagi@bloomberg.net, Andrew Dunn, Dave Liedtka
©2018 Bloomberg L.P.