Valuation Charts All Over Map and That’s a Problem for Stocks
Valuation Charts All Over Map and That’s a Problem for Stocks
(Bloomberg) -- There has never been a bull market in stocks that lasted as long as this one. A big reason it’s a week shy of its 11th anniversary has been that at every critical juncture, all those moments when a wave of panic seemed set to engulf the market, the buy-the-dip crowd came to the rescue, snapping up shares and turning the rout into a rebound.
Those buyers were driven by an unwavering belief in the earnings power of U.S. companies and a conviction that when valuations — expected earnings divided by share price — got cheap, they had to buy.
That mindset is getting tested now. The coronavirus-induced selloff — which shaved 11% off stocks last week alone — is introducing new elements that call into question earnings -- the ‘E’ part of price-earnings ratios.
And the news only got worse over the weekend. The U.S. reported its first related fatality and Washington’s governor declared a state of emergency. Cases spread rapily in the U.K. and Iran as other countries imposed travel restrictions. China’s economy looked set to contract, and Goldman warned American companies may not see any profit growth this year.
“The problem is, you don’t know if the E is sustainable. Sixteen times earnings may turn out to be 25 times earnings, if the earnings are falling,” John Carey, managing director and portfolio manager at Amundi Pioneer Asset Management, said by phone. “We don’t know the extent or the duration of the coronavirus.”
And that sows further doubt into the minds of the bargain hunters. Still, many of them will try to make a case for jumping in now. Here are three possible scenarios — seen from both an optimist’s and a pessimist’s point of view — for valuatoins that take into account the altitude of interest rates, the persistence of growth and the reliability of earnings estimates.
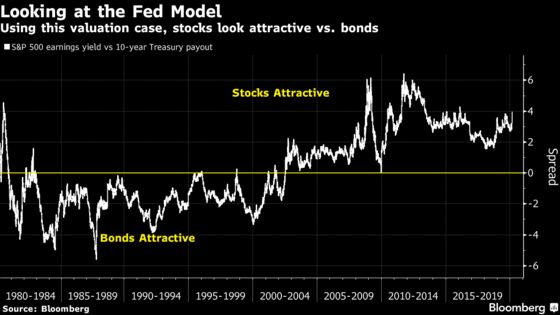
Fed Model
Equity bulls can take the most comfort in a methodology sometimes called the Fed model that compares corporate profits to bond yields. All things being equal, it shows shares are better priced than any time in five years. By that measure, the S&P 500’s earnings yield -- how much profits you get relative to share prices -- is about 4 percentage points above the yield on 10-year Treasuries. That’s the biggest advantage since February 2016.
A similar framework considers the payout corporate America is handing out to shareholders. As of Friday, almost 60% of S&P 500 members offer dividend yields that exceed that on 10-year Treasury notes. That’s the highest proportion in at least two decades, data compiled by SunTrust Private Wealth Management and Bloomberg showed.
The widening yield advantage is one reason that Wells Fargo & Co.’s strategists led by Chris Harvey see a bottom forming for the market. “We suggest adding risk to the portfolio as well as putting new money to work,” they wrote in a note.
Skeptics remain. Some see nothing but recession signals in record-low bond yields. That would of course bode poorly for earnings and the stock market.
“Stocks are clearly the more attractive yield play,” Ed Clissold, chief U.S. strategist at Ned Davis Research, said in a phone interview. “The question is if those yields are valid. How big of an impact in earnings will there be and will companies need to cut dividends? That’s where that becomes tricky.”
Earnings Scenarios
While the speed of the correction caught investors off guard, to many analysts it was a long overdue reckoning. At its record on Feb. 19, the S&P 500 traded at 19 times forecast earnings, the highest level since the dot-com era. Now it’s 16.6, roughly in line with the five-year average.
Alas, it’s a little simplistic to think that the valuation problem has been fixed. The rapid spread of the coronavirus has prompted companies from Apple Inc. to Microsoft Corp. to slash sales forecasts. That calls into question any assumption earnings will rebound this year.
“I’m suspect of 2020 earnings,” Doug Ramsey, chief investment officer at Leuthold Group, said in an interview at Bloomberg’s New York headquarters. “Earnings really could crater because of this, because of the virus.”
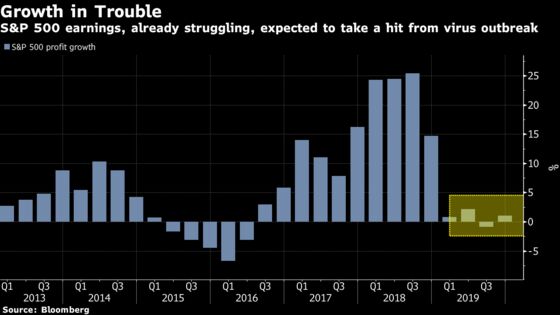
Going by consensus analyst estimates, S&P 500 companies will boost profits by about 7% this year, with energy and technology firms expected to lead a pickup in growth. Yet with the virus outbreak disrupting global supply chains and hurting demand for travel, those targets are starting to seem fanciful.
Goldman Sachs Group Inc.’s strategists led by David Kostin last week trimmed their profit estimates, citing the virus. Growth for the S&P 500 will be flat this year, they predicted. In that case, stocks look much less attractive. At Friday’s close of 2,954.22, the S&P 500 would be valued at 18.4 times earnings, rather than the current reading of 16.6.
A more ominous scenario, Kostin warns, is that the virus gets out of control and the economy falls into a recession. Should that happen, profits would slide 13% this year, he predicts, causing a bear market and then some.
“The trajectory of the U.S. and global economy is highly uncertain at this time,” he wrote in a note. “For modeling purposes, we assume economic growth slows sharply during 1H 2020, but rebounds in 2H 2020 and 2021. A more severe pandemic could lead to a more prolonged disruption and a U.S. recession.”
PEG Ratio
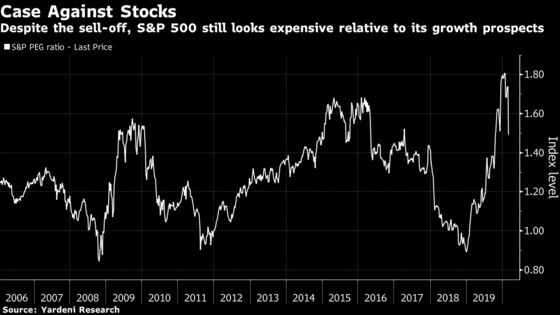
Even if you’re willing to ride out the volatility and put faith in prospects for long-term growth, stocks can still be framed as pricey.
At Friday’s close, the forward price-earnings multiple for the S&P 500 came out to 1.5 times the rate at which analysts expect profits to rise over the next five years, according to a model kept by Yardeni Research Inc. While that reading in an indicator known as the PEG ratio is down from a record high of 1.8 reached in January, it’s still way above 1, a level that marked the bottoms during sell-offs in 2008, 2011 and 2018.
To contact the reporters on this story: Lu Wang in New York at lwang8@bloomberg.net;Vildana Hajric in New York at vhajric1@bloomberg.net
To contact the editor responsible for this story: Jeremy Herron at jherron8@bloomberg.net
©2020 Bloomberg L.P.