U.S. Equities Selloff Carries Worrying Technical Warning Signs
U.S. Equities Selloff Carries Worrying Technical Warning Signs
(Bloomberg) -- As risk weighs on global markets, the S&P 500 Index is showing some troubling technical patterns.
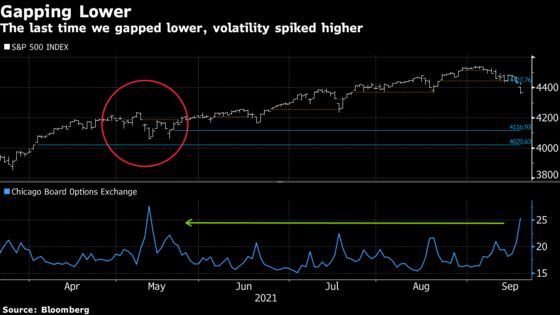
Futures on the S&P 500 Index gapped lower at Monday’s cash equities open, meaning they started trading beneath the previous session’s range. It’s the first time they’ve done that since May.
While the contracts have gapped higher several times over the past few months, this drop is significant because pullbacks have been rare recently, and shallow -- never crossing more than 3%. Including Monday’s selling, the downturn since the S&P 500’s Sept. 2 record is now almost 4%. The Cboe Volatility Index, or VIX, jumped 4.2 points to the highest it’s been since the May, when a selloff also brought a spike in turbulence.
The S&P 500 is down 3.4% this month, and a lack of breadth remains a key culprit, just as it was in May. The rotation away from value and the recovery trade into higher-yielding sectors like utilities and consumer staples and reliable growth stocks, particularly large-cap tech, has been a key indicator of investors turning more defensive.
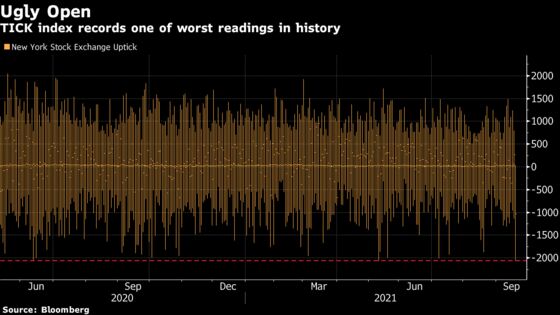
In addition, the NYSE Uptick Minus Downtick index, a measure of how many listed stocks move in the same direction on the same tick, hit -2,067 at the open, or just two ticks shy of the level reached during the last major pullback in mid-May.
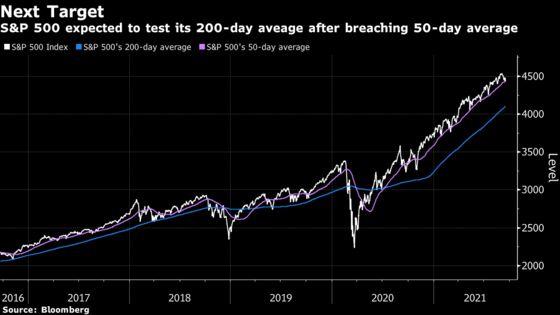
The opening gap lower has also breached the S&P 500’s heavily watched 50-day moving average. Should the index close below the level for a second consecutive session, it would break a threshold that had served as support for much of this year. Before Friday, the S&P had avoided back-to-back closings below the trend line for 218 straight sessions, the longest run since 1996, according to data compiled by Bay Crest Partners and Bloomberg.
With two weeks of slow-motion down days morphing into a deeper rout, some traders are watching the S&P 500’s 100- and 200-day moving averages for potential downside. The latter level, currently near 4,100, represents a 15% drop from Friday’s close. The index hasn’t breached that mark for 320 trading days, a streak not seen since the start of the bull market in 2009, according to a note by Yardeni Research this morning.
“The S&P 500 is overdue for at least a retest of its 200-dma,” Yardeni wrote.
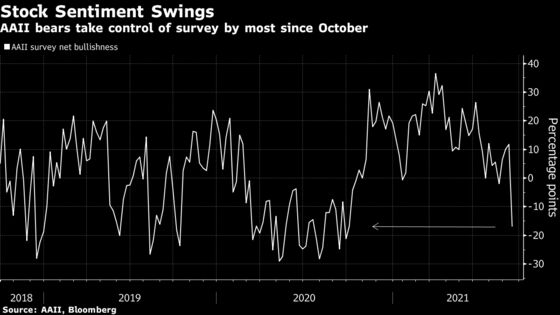
Recently, the 50-DMA has served as a trigger for dip buying. But this pullback has some questioning whether investors will return to the U.S. stock market. The investor bull-bear spread is the most negative since October, so sentiment isn’t encouraging. The last time the spread looked like this investors were positioning for the U.S. presidential election and all the risk that surrounded it. This time, positioning for the Federal Reserve meeting Wednesday and the possibility of an announcement about curtailing stimulus may be at the center of the selloff.
Seasonality is also a key factor. September is known for heavy selling, following light summer trading volumes. Last year’s “tech wreck” happened in this month, and there have been seven negative Septembers in the last 10 years.
©2021 Bloomberg L.P.