Oil’s Historic Tumble Illustrated in Charts
The plunge in oil prices to near $30/bbl takes the market back to early 2016 when rising U.S. shale exports caused a global glut.

(Bloomberg) -- The sudden plunge in oil prices to near $30 a barrel takes the market back to early 2016 when rising U.S. shale exports caused a global glut.
Monday’s collapse was triggered by a breakdown in the OPEC+ alliance after Russia balked at Saudi Arabia’s demand for deeper output cuts to cope with the coronavirus. Not only will those reductions now not happen, but the current curbs will expire at the end of this quarter. To add to that, the kingdom is aggressively opening the taps to flood the market with cheap crude.
Ironically, crude prices are now back at levels that spurred the creation of the OPEC+ grouping. Here are five charts illustrating a historic day in oil markets.
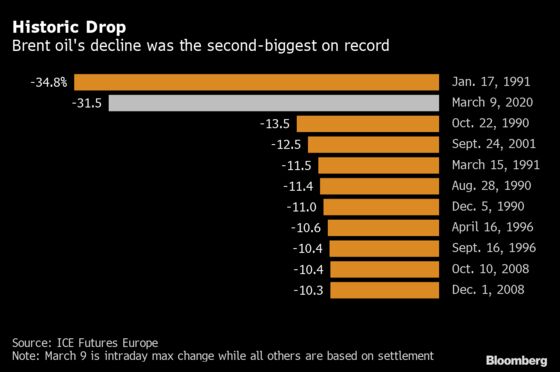
The descent early Monday morning in Asia was dramatic. Global benchmark Brent crude plummeted more than 31% shortly after the open, the most since the Gulf War in 1991. Trading in West Texas Intermediate, which fell as much as 34%, was frozen for a few minutes because of the scale of the loss.
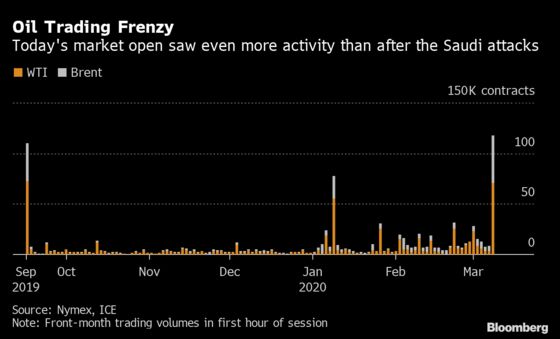
Trading was frenzied, with more than 115,000 Brent and WTI front-month contracts changing hands in the first hour after the open. That eclipsed the level of activity in the first hour of trading on Sept. 16, after drone attacks on key Saudi oil infrastructure spurred a record gain in Brent prices
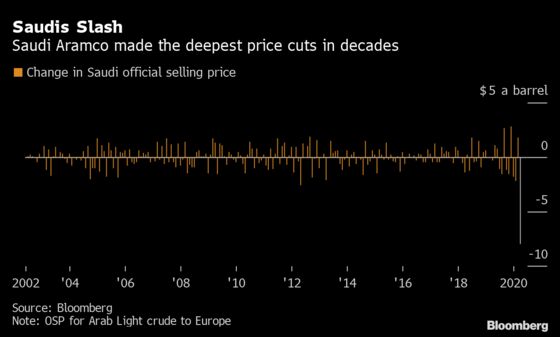
The catalyst for the drop was Saudi Arabia’s move to slash its official selling prices for crude in an attempt to win back market share from Russia and U.S. shale producers. Prices of the kingdom’s flagship Arab Light grade to northwest Europe were cut the most in a not-so-subtle challenge to Russia’s Ural blend.
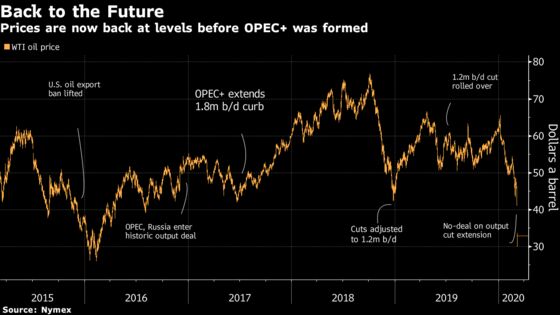
Global oil markets are now back where they were prior to OPEC’s alliance with Russia and some other producers in 2016. Moscow’s decision not to back deeper cuts, which spurred the Saudi reaction, will hurt American shale and may be aimed at punishing the U.S. for its repeated sanctions on Russia’s energy interests, according to Julian Lee, a Bloomberg oil strategist.
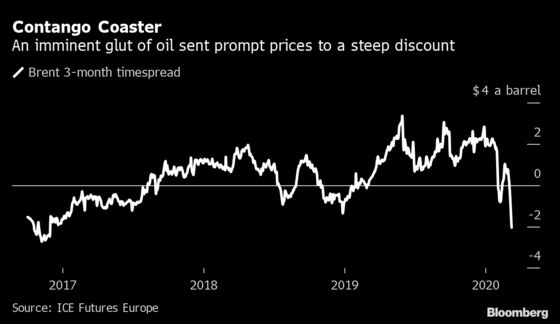
The prospect of a sudden flood of cheap oil pushed Brent deep into contango, a market structure that reflects over-supply and makes it profitable for physical traders to buy crude and put it in storage, either onshore or at sea in tankers.
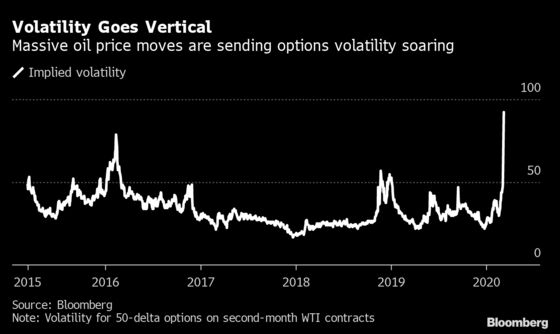
Not surprisingly, implied volatility in WTI has skyrocketed and is now well above where it was in early 2016. That means a windfall for investors who were savvy enough to buy options contracts protecting themselves from big swings.
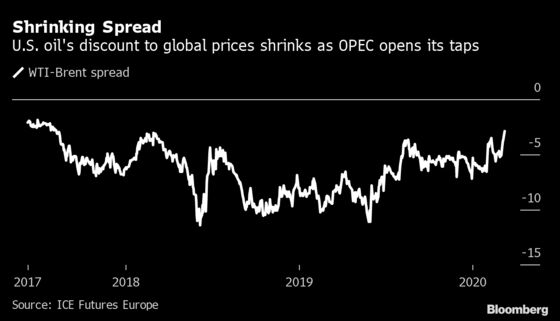
As OPEC nations prepare to open the taps, the spread between the global and U.S. benchmarks is narrowing sharply. The premium of Brent to WTI is now at the narrowest since 2017 as the former tends to bear the full brunt of worldwide supply imbalances, while the latter is more reflective of the domestic American market.
--With assistance from Serene Cheong.
To contact the reporters on this story: Dan Murtaugh in Singapore at dmurtaugh@bloomberg.net;Andrew Janes in Singapore at ajanes@bloomberg.net
To contact the editors responsible for this story: Serene Cheong at scheong20@bloomberg.net, Ben Sharples
©2020 Bloomberg L.P.