These Charts Indicate Calm Has Returned to Japan’s Stock Market
These Charts Indicate Calm Has Returned to Japan’s Stock Market
(Bloomberg) -- After bouts of panic selling in March followed by a sharp rebound, trading of Japanese equities has returned to a range that almost looked like normal again.
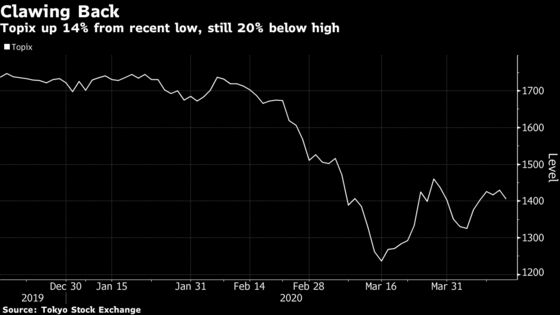
Volumes, volatility levels and technical indicators have all backed off from extremes. The benchmark Topix index is up more than 14% from its March 16 low, though still 19% below its Dec. 17 high. The tentative recovery was helped by signs of slower growth in global coronavirus infections, but further gains will depend on whether or not there’s a second major round of cases and how fast economic activities resume, said Shogo Maekawa, a strategist at JPMorgan Asset Management Ltd.
“The V-shaped recovery we’re seeing may turn into a W-shaped one instead, where we see another bottom,” he said.
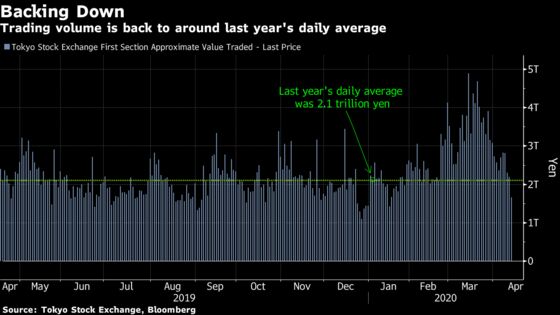
Daily traded value on the first section on the Tokyo Stock Exchange, which Topix basically mirrors, reached a two-year high of 4.9 trillion yen ($45 billion) on Mar. 13. Volumes have since dropped, with the average daily value this month around 2.5 trillion yen.
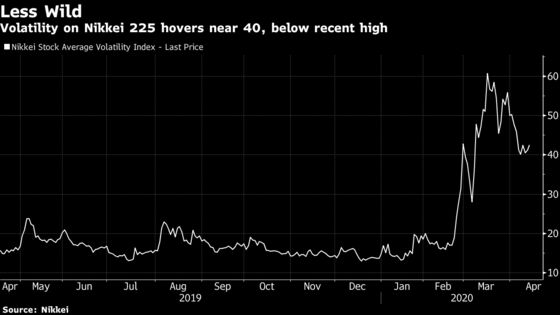
Volatility on the blue chip Nikkei 225 Stock Average has pulled back after topping 60, a level unseen since the earthquake and tsunami in March 2011. Its move mimicked a retreat in the Cboe Volatility Index, or VIX, which is also off its March highs. The Nikkei’s “fear gauge” is still elevated at levels above 40.
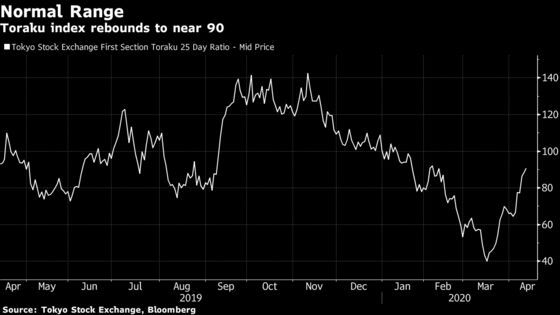
The 25-day Toraku index, which compares the numbers of advancing stocks and declining stocks on the Topix, stood at about 90 on Monday. That marked the fourth straight day the gauge has held above 80, a level below which traders see as a signal that shares are due for a rebound. Above 120 is seen as overbought.
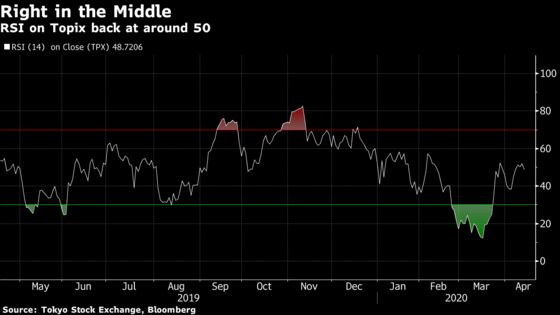
The 14-day relative strength index on the Topix is now hovering in the 40-50 range, recovering from levels below 30 that signal a market may be oversold. It’s also still safely below 70, a level which indicates to some traders that stocks have risen too far, too fast.
Key data points returning to normal ranges may be a source of comfort for some market participants. But as to whether this recent calm will last, Maekawa says: “Nobody knows that.”
©2020 Bloomberg L.P.