The Technical Sell-Signal With a 100% Hit Rate for Dip Buyers
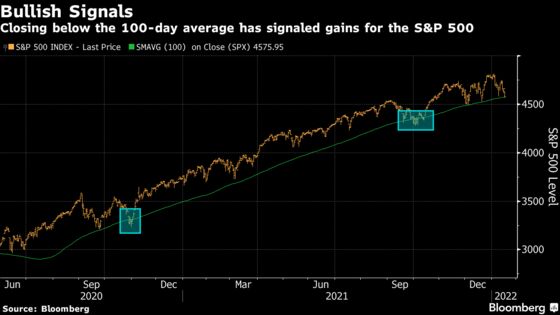
Closing below the 100-day average has signalled gains for the S&P 500.

(Bloomberg) -- It’s crunch time for the buy-the-dip crowd.
The S&P 500 is threatening to close below its 100-day average -- having already slipped below that measure intraday Tuesday for the first time in more than three months.
Drops through moving averages can be seen as concerning because they may signal a change in momentum -- but in this case, buying the next day has been an almost sure-fire winner for the past 19 months.
Since June 2020, the benchmark has closed below its 100-day average eight times, data compiled by Bloomberg show. Three of those instances, it never traded lower after that, even intraday, and three times there was never a lower close after. One of the occurrences there was one lower close -- by 0.03% -- before it headed higher, and the worst time was one close 0.16% lower before it recovered, the data show.
Dip-buyers in U.S. stocks have tended to be rewarded over the long term in the aftermath of the Global Financial Crisis, with 10 “up” years -- all but one with double-digit gains -- versus one flat and two down years with losses of 0.7% and 6.2%. That even factors in the pandemic-fueled collapse that bottomed in March 2020 before turning into a rapid recovery; the gauge ended that year up 16%.
Still, 2022 has started with markets particularly on edge. Recovery from the worst days of the pandemic, fueled by stimulus from both central banks and governments, is now making way for concerns about quickening inflation and prospects of rate hikes from the Federal Reserve and its peers. That line of support may be tested more now than it has been in some time.
©2022 Bloomberg L.P.