Technicals the Pros Are Watching After This Instant Bull Market
U.S. stocks’ heady jump from lows just a few days ago is forcing another reassessment of key levels and market direction.

(Bloomberg) -- U.S. stocks’ heady jump from lows just a few days ago is forcing another reassessment of key levels and market direction.
The S&P 500 Index’s 18% gain over three days left it at 2,630.07 on Thursday, with those intraday lows below 2,200 on Monday almost feeling like a distant memory. Of course, this still leaves the gauge 22% below its Feb. 19 record high, as investors grapple with the global spread of the coronavirus and its potential effect on everything from economic growth to financial systems.
Here are some technical levels analysts and strategists are watching:
Fibonacci Fervor
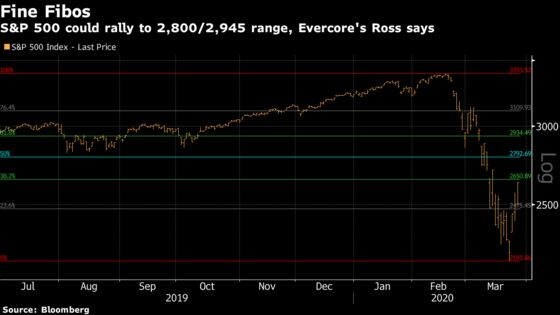
“Keep buying the rip,” said Evercore ISI technical strategist Rich Ross in a note Thursday. “The powerful tactical rally to 2,800/2,945 remains intact and continues to strengthen on the back of high-conviction bullish risk reversals” across the likes of credit, volatility, cyclical shares, Europe and Asia. The range he cited corresponds roughly with the 50.0% and 61.8% Fibonacci retracement levels between the February peak and the depths earlier this week.
200-Week Average
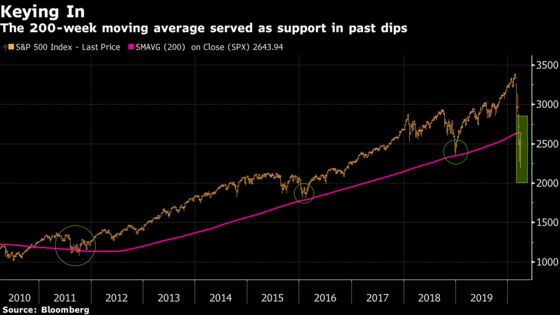
The S&P 500’s moving average over the past 200 weeks -- now around 2,644 -- was a key level cited as support on the way down by the likes of Miller Tabak & Co.’s Matt Maley. Thursday’s close was awfully close to it, so this one may get another look.
Gain Before a Retest
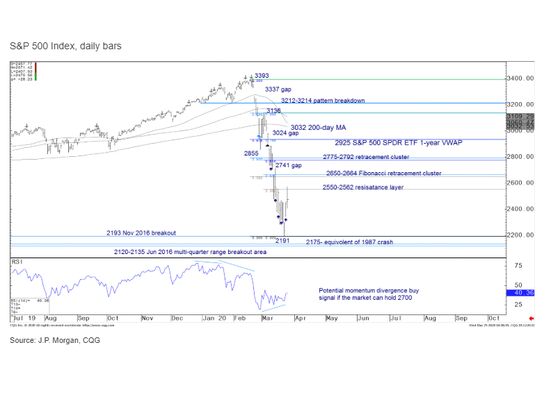
“An oversold rebound can extend further over the near term to test the 2,643-2,664 200-week moving average and Fibonacci retracement level confluence, as well as the 2,711-2,741 March 12 price gap,” JPMorgan Chase & Co. technical strategists Jason Hunter and Alix Tepper Floman wrote in a note Wednesday. “A reflex rally of that magnitude (~20%-25%) would be in line with short-term rebounds following similar price collapses in October 2008, October 1987, and October 1929,” they said, but cautioned that such advances could fade and set the market up for a potential retest of the March lows.
Death Cross
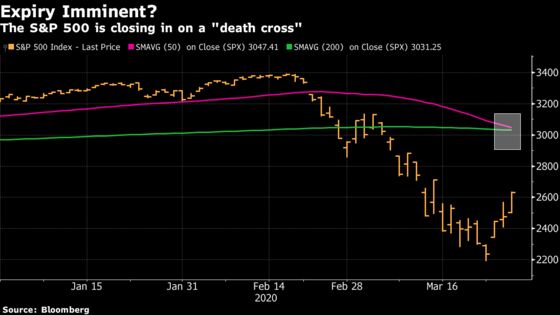
One thing to be on alert for, of course, is a phenomenon that some say is a bearish signal: the death cross, which occurs when the 50-day moving average falls below the 200-day line. The former ended Thursday at 3,047, while the latter sits at 3,031.
The cross already happened for the MSCI All-Country World Index, but Sundial Capital Research Inc.’s Troy Bombardia says it may not be such a negative signal this time around.
Selling on a death cross “did allow you to avoid some major bear markets” in the past, he said in a note Wednesday. But since the MSCI gauge cross “came after the stock market crashed, I don’t think it’ll be very useful this time. The stock market’s crash happened so quickly and the death cross came too late to protect investors. I wouldn’t consider this to be a bearish factor for stocks.”
©2020 Bloomberg L.P.