Staring Into Void May Pay Off for Traders Focused on Gaps
Staring Into the Void May Pay Off for Traders Focused on Gaps
(Bloomberg) -- Traders may want to pay closer attention to the gaps in their price charts.
It’s rare for highly liquid financial markets like currencies and futures contracts to have spaces indicating levels where no trading occurred. But this year, pandemic risks have caused assets to recoil unexpectedly, creating voids.
These gaps represent potential profit-making opportunities for exponents of a technical analysis theory that posits these kinds of gaps must eventually be filled. And with second-wave virus fears brewing and U.S. elections on the horizon, there may be more of these types of moves ahead.
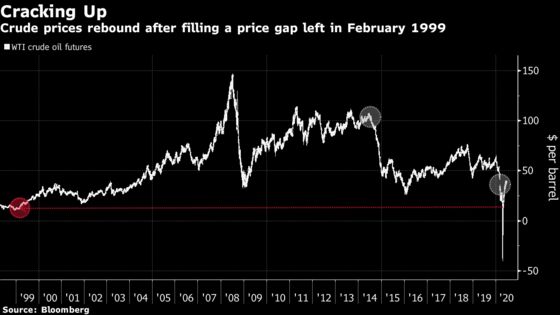
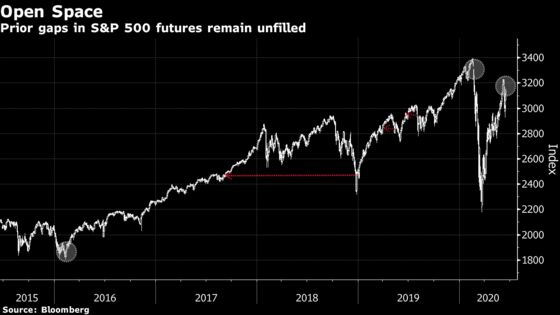
Followers of this form of technical analysis were neither surprised to see oil touch $12 a barrel nor subsequently bounce back from sub-zero levels to trade above $40. They would also have bet U.S. share prices would return to all-time highs after being down over 30% in March and may have even turned more bullish with the selloff this month.
These prognosticators foresee 10-year Treasury yields eventually touching 2.192% and the euro traveling up to 1.3221, stuffing cavities in pricing from May 31, 2019, and Aug. 25, 2014, respectively. The speed of the ascent will vary but the destination, in their minds, is assured.
Such voids in asset prices, while not uniform, may result from a position build-up, followed by a change in fundamentals that trigger sharp adjustments higher or lower, often during a weekend or times of low liquidity. While bouts of exuberance, for example, can potentially pinpoint a medium-term trend, they invite a correction once a period of calm ensues. That said, it can take weeks or years for gaps to fill. But they nevertheless seem to do so eventually with surprising consistency.
Oil futures are a shining example. A tumultuous March sent the near-contract in West Texas Intermediate below zero and, in the process, filled a price gap at $12.03 from 1999. Crude bulls may be encouraged to hold onto long positions to capture momentum after the one at $41.05 was covered this week, though a trader may be near retirement before reaping rewards from the 2014 unfilled gap at $103.89.
For those with less patience, opportunities in currencies or equity futures markets may be better-suited. Over the past decade, there have been eight openings in the front WTI contract, compared with 13 for S&P 500 e-mini futures, according to Bloomberg’s GAPS function. The two most recent and yet to be filled are at 3328.00 and 3179.75, the respective lows on Feb. 21 and June 10, indicating a bullish trend, based on gap theory. However, there are also two gaping voids below the 2000 level dating back over four years -- ones that many investors and policy makers would not want to see challenged.
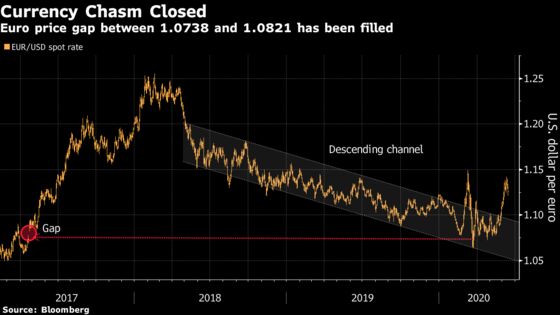
For major currencies, price gaps are more rare, with only five in the euro-dollar pair in the past 10 years. While none have occurred this year, the one created after the weekend of France’s first presidential ballot in April 2017 closed on March 19, after retracing a more than 15% advance. It has since risen around 5% with traders turning more bullish as golden cross forms in the pair.
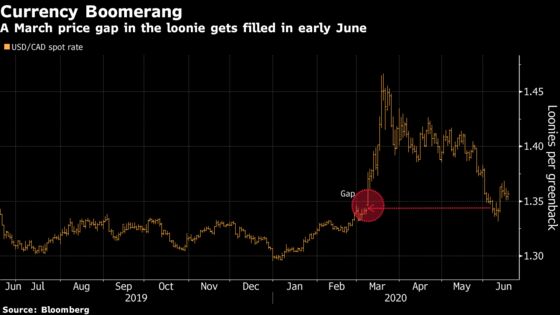
In theory, once an information void is filled, prices are free to travel in either direction unencumbered, but often do an about face. Currency options can help capture both the initial price surge following the gap and subsequent steady path of retracement. This month saw the closing of a gap in the exchange rate between U.S. and Canadian dollars that was created by America’s declaration of a state of emergency in early March. A rebound in oil prices and improved risk sentiment helped that to close up on June 5 and -- as was the case with the euro example -- the U.S.-Canadian pair has since reversed course.
Dollar-yen and various other Japanese currency cross rates have experienced similar moves in the past couple years and a rally in bonds in the spring of 2019 helped 10-year Treasury futures fill a price gap from September 2017 -- at the time, the only such unfilled gap in the last few decades.
For most liquid assets, these gaps are antithetical to the efficient market hypothesis and their relative rarity perhaps attests to this. But as Warren Buffett noted back in a 1984 talk at Columbia Business School, stock prices can be influenced by a “herd” on Wall Street, convincing him that “there is much inefficiency in the market.”
Related Stories on Chart Gaps |
|---|
Yen Gap in Play as Greenback’s Upward Momentum Builds: Chart A Brewing Liquidity Trap Brings Euro Price Gap Into Focus: Chart Canadian Dollar Surpasses Key Moving Average on Way to Price Gap Offshore Yuan-Yen Flashes Risk-On as Trade Deal Nears: Chart Swiss-Yen Breaks Trend Line Resistance After Filling Gap: Chart Treasury Futures Gap Suggests Rally Could Run Further: Chart Gaps in 10-Year Treasury Futures Point to Further Losses: Chart |
NOTE: Robert Fullem is an FX and rates strategist who writes for Bloomberg. The observations he makes are his own and are not intended as investment advice
©2020 Bloomberg L.P.