Save the Date: June 10 Is When Charts Say the Stock Turmoil Will End
Save the Date: June 10 Is When Charts Say the Stock Turmoil Will End
(Bloomberg) -- Wondering when the chaos in markets will cease? June 10.
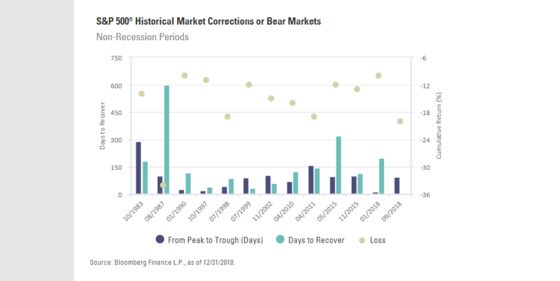
Or anyway, that’s the goofily specific target one analyst gets when overlaying charts from corrections since 1983 on this sell-off and assume Dec. 24 was its bottom. According to Matthew Bartolini, head of Americas research at State Street’s ETF business, it’s taken 168 days on average for the S&P 500 to bounce all the way back from a correction or full-fledged bear market over that span.
Concerns ranging from slowing corporate and economic growth to faster rate hikes pushed the S&P 500 down as much as 19.8 percent by Christmas Eve and yanked $5 trillion from the value of U.S. equities. It took the index a month to recoup half of the losses -- the index is now down 10 percent from its peak.
“The road to any potential June recovery is likely to be a bit rocky as the market’s trilogy of troubles (political brinkmanship, slowing growth, uncertain monetary policy) are not going to be resolved in a swift manner,” Bartolini said in a blogpost dated Jan. 15, adding that the path to recovery could take longer as U.S. economic growth is projected to decline in 2019 from a year ago.
To contact the reporter on this story: Elena Popina in New York at epopina@bloomberg.net
To contact the editors responsible for this story: Courtney Dentch at cdentch1@bloomberg.net, Chris Nagi, Jeremy Herron
©2019 Bloomberg L.P.