U.S. Stock Selloff Takes Indexes to Key Technical Levels
The selloff in U.S. stocks has major indexes testing technical levels of support for the first time in seven weeks.

(Bloomberg) -- The selloff in U.S. stocks has major indexes testing technical levels of support for the first time in seven weeks.
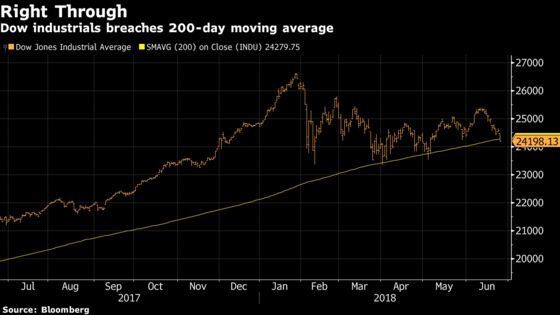
The S&P 500 Index sank as much as 1.5 percent Monday to 2,710.79, piercing its average price for the past 50 days for the first time since May 9. The Dow Jones Industrial Average’s ninth loss in 10 sessions has wiped off more than 1,100 points since June 11. It’s now at 24,185.64, below its average price for the past 200 days for the first time since early May.
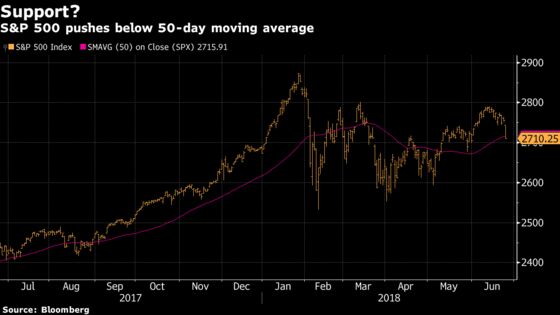
To chart watchers, an extended break below the moving average may mean further losses because investors typically place trades around such levels. It can also also act as support as dip-buyers move in.
Stocks tumbled around the world Monday, with technology shares leading declines on reports the U.S. Treasury Department plans to release fresh rules on Chinese investment in technology companies.
To contact the reporter on this story: Randall Jensen in New York at rjensen18@bloomberg.net
To contact the editors responsible for this story: Jeremy Herron at jherron8@bloomberg.net, Andrew Dunn
©2018 Bloomberg L.P.