S&P 500 Chart Tracking 2008 Signals Danger to RBC’s Calvasina
S&P 500 Chart Tracking 2008 Signals Danger to RBC’s Calvasina
(Bloomberg) -- Plotting the S&P 500’s chart now versus 2008 reveals similarities, at least to the naked eye. For Lori Calvasina at RBC Capital Markets,it means investors should prepare for the sell-off to get worse should recent support fail to hold.
Specifically, the benchmark index could tumble to 1,725 if it undercuts 2,300, a level that was close to the trough during the late-2018 sell-off and was briefly breached Wednesday, says the strategist. A drop to that would represent another 28% decline from the last close of 2,398 and take the market to levels not seen since 2013.
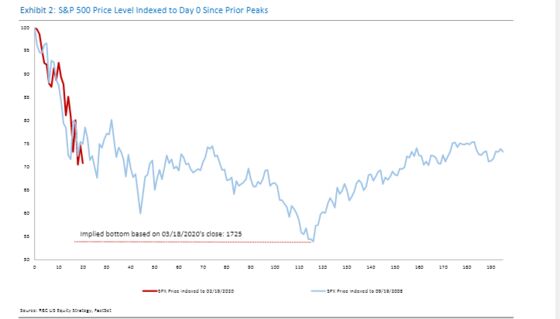
“The recent price action in the S&P 500, as well as the Fed’s aggressive moves and emergency call over the weekend, has reminded us of the worst days of the Financial Crisis,” Calvasina wrote in a note. “If the S&P 500 were to continue down that road, it would bottom around 1,725.”
Strategists have been urging investors to prepare for the worst after stocks fell into the fastest bear market ever. Risky assets sold off as the coronavirus outbreak is expected to tip the global economy into a recession. David Kostin at Goldman Sachs warned last week that the market might not bottom until the S&P 500 hit 2,000.
Calvasina now anticipates an economic recession to take place over the next two quarters before a recovery starts in the final months of 2020, as opposed to one quarter of contraction forecast previously. She cut her S&P 500 forecasts for a second time this month, predicting the index to end the year at 2,750. That’s down from a February projection of 3,460.
©2020 Bloomberg L.P.