S&P 500 Chart Shows Perfect Symmetry Beneath Chaotic Market
S&P 500 Chart Reveals Perfect Symmetry Beneath a Chaotic Market
(Bloomberg) -- In a world of virus-driven financial market chaos, one number appears to have set a harmonious tone for the S&P 500.
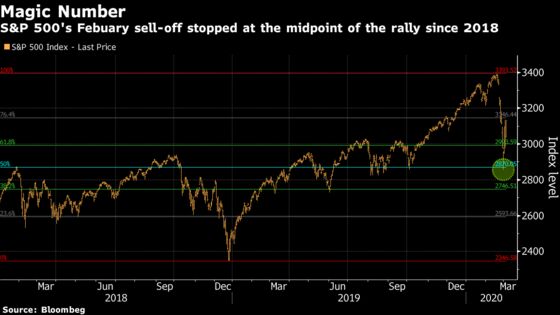
It’s the 50% retracement level that technical analysts use to predict inflection points based on an 800-year-old mathematical principle. On the way down to its swiftest correction from an all-time high, the S&P 500 found its support at 2,870. That corresponded to the midpoint of the entire rally since the late 2018 sell-off.
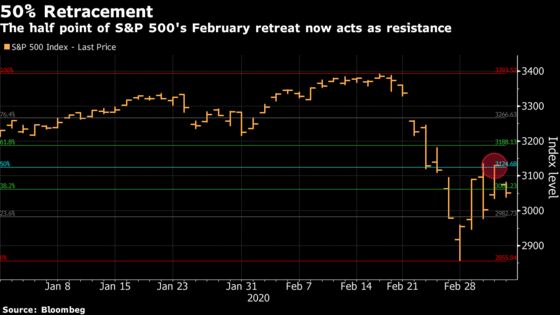
Similarly, as the benchmark gauge bounced back from last Friday’s low, the midpoint of its February retreat, or 3,125, has acted as line of resistance. The index briefly surpassed that threshold Tuesday before succumbing to selling. It closed right on the cusp of it Wednesday and then again failed to hold it, with the S&P 500 falling to 3,022.96 as of 1:25 p.m. in New York.
The precise stop point in either direction may offer some help for investors seeking to find clarity in a market reigned by violent price swings and reversals. The S&P 500 has alternated between big gains and losses every day this week as investors assess the risk from the rapid spread of the coronavirus to the economy while the Federal Reserve made its first emergency interest-rate cut since the 2008 financial crisis.
“Nobody really knows about what this coronavirus is going to have in terms of earnings impact, but the market is technically trading perfect,” Craig Johnson, chief market technician at Piper Sandler & Co., said by phone. The chart “became a framework to think about reset levels and technicals gave us pretty good signals,” he said.

According to Fibonacci analysis, a system pioneered by 13th Century mathematician Leonardo of Pisa, stocks tend to wipe out 61.8% of their losses after erasing a 50% decline, or vice versa.
The 50% retracement level is just one of the key technical levels that are widely watched by traders to gauge the market’s momentum. Some threshold, such as the S&P 500’s 200-day moving average, currently around 3,051, has played a key role in some computer-driven models. According to JPMorgan strategist Marko Kolanovic, a drop below that threshold Tuesday sparked selling from trend-following traders, such as commodity trading advisers, or CTAs.
On the way down, Johnson at Piper said he’ll also watch whether the S&P 500 will be able to hold the level around 2,950. That’s where the index peaked in September 2018 and May 2019.
--With assistance from Rita Nazareth.
To contact the reporter on this story: Lu Wang in New York at lwang8@bloomberg.net
To contact the editors responsible for this story: Courtney Dentch at cdentch1@bloomberg.net, Richard Richtmyer, Joanna Ossinger
©2020 Bloomberg L.P.