Peter Lynch Stock ‘PEG’ Hit Crisis-Level Low in Last Week's Rout
Peter Lynch Stock `PEG’ Hit Crisis-Level Low in Last Week's Rout
(Bloomberg) -- For an investor with a fair amount of faith in Corporate America’s ability to churn out profits, equities got almost historically cheap during the worst of the Christmas sell-off.
At Wednesday’s low, the S&P 500’s forward price-earnings ratio came out to 0.85 times the rate at which analysts expect profits to rise over the next five years, according to a model kept by Yardeni Research Inc. It’s just a tool, one with a spotty record for market timers, but right now it’s depressed.
The multiple, a version of something known as the PEG ratio that famous investors like Fidelity’s Peter Lynch favored, matched levels at the bottom of the financial crisis. Adjusting P/Es for growth is one way of showing how stocks have become unhinged from earnings -- or earnings estimates, anyway -- after a three-month decline drove the S&P 500 to the brink of a bear market.
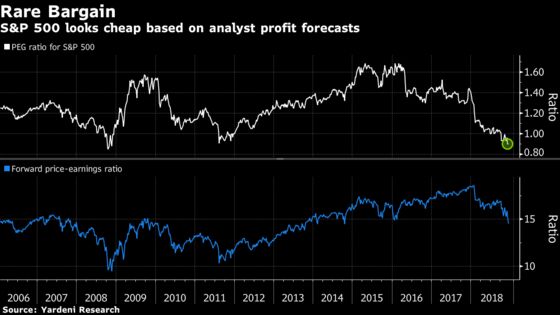
Extreme readings in the PEG reflect both below-average valuations and the still relatively bright view Wall Street takes of future profit growth. Therein lies its utility for someone who thinks a standard P/Es is too static -- and therein lies a defect, too.

“A fatal flaw in the model right now would be if in fact we fall into a recession, in which case the P/Es could go even lower,” said Ed Yardeni, the president of his namesake research firm. “But if you agree with me and others that there is no recession out there, only slower growth, and slower growth also means the Fed is done for a while, then this is another buying opportunity.”
About $6 trillion has been erased from equity values since the market’s peak in September as the Federal Reserve’s rate hike and lingering U.S-China trade tensions fueled concern economic growth will slow. At Wednesday’s low, the S&P 500 was two points away from entering a bear market decline of 20 percent.
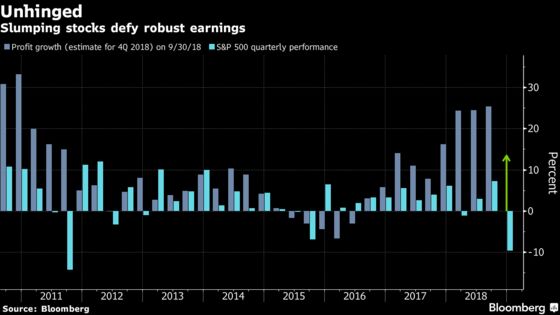
Ironically, all the losses are coming in a quarter when S&P 500 companies are expected to report a 13 percent increase in earnings. How odd is that? If analyst estimates come true for the quarter, it’d be the fourth time during the last two decades where a 10 percent decline in stocks coincided with a profit expansion of that size, data compiled by Bloomberg showed.
While the PEG ratio highlights the upward trajectory of growth, its record as a tool for market timing is mixed. The S&P 500’s PEG ratio has averaged 1.3 since 1995, spending most of the time above 1, based on Yardeni’s data. The ratio fell below the threshold for the first time during the fourth quarter of 2008, just months before the bottom of the 2007-2009 bear market.
At the same time, investors who followed the ratio to sell in 1998, 2004 and 2009 would have missed some of the biggest rallies. The PEG’s bottom in late 2000 also sent a false buy signal as the dot-com crash didn’t end until 2002.
One reason that valuation metrics such as the PEG ratio do a poor job in identifying market turns is that they fail to account for things like fiscal policies and business cycles, according to Julian Emanuel, chief equity and derivatives strategist at BTIG LLC In New York.
“The biggest macro force that has distorted the utility of this PEG ratio is this one-time boost to earnings from tax cuts,” Emanuel said. “Part of the reason that the market suspects the returns you’ve had in stocks this year is the whole idea that this one-time boost to earnings has essentially created the psychology of peak everything. It’s very hard to disentangle what the normal is, given the extreme abnormality of earnings growth this year.”
In his 1989 book “One Up on Wall Street,” Lynch wrote that a stock is fairly valued when its PEG ratio equals 1. He produced average annual returns of 29 percent managing Fidelity’s Magellan Fund from 1977 to 1990, almost double the gain in the S&P 500 over the same period.
While the earnings machine that has powered the bull market toward its 10th anniversary is poised to decelerate, there are few signs of its collapse. With the tax cuts largely reflected, profit growth will slow to half the pace seen in 2018 over the next two years. But at an average 10 percent, it’s pretty much in line with the historic rate since 1998.
That’s good news for investors at a time when valuations have resisted expansion. At about 14.4 times forecast earnings, the index’s P/E is 12 percent below its average in the past two decades, data compiled by Bloomberg showed.
Today, 132 companies in the S&P 500 with expected earnings growth, including Celgene Corp., Discovery Inc., and Bank of America Corp., have a PEG ratio below 1. A year ago, only 38 stocks were that low.

Earnings don’t seem to matter now because recession fears are ruling sentiment, but they eventually will, according to Tobias Levkovich, chief U.S. equity strategist at Citigroup.
“Clients tell us that they do not see a recession in 2019 and many do not discern one before 2021, but concerns abound given the possibility that a feedback loop forms,” he wrote in a note. “We believe that the selloff has been extreme and unwarranted, with investors, who have longer-term time horizons, getting an opportunity to buy when the bargains are in front of them.”
To contact the reporter on this story: Lu Wang in New York at lwang8@bloomberg.net
To contact the editors responsible for this story: Jeremy Herron at jherron8@bloomberg.net, Chris Nagi
©2018 Bloomberg L.P.