Owning IPOs Has Been Clunker of a Trade Amid Raging Bull Market
These are some of the biggest themes in the past decade’s initial public offerings.

(Bloomberg) -- Getting fancy didn’t pay off in stocks this decade. Investors who looked to newly public companies to enhance their gains instead found themselves trailing the red-hot market, often by a lot.
History’s longest-running bull market nonetheless has been a boon for issuers, who took advantage of calm conditions that fueled investor appetite for deal activity.
Outperformance from mega-listings, especially in the technology sector, played a critical role in bringing IPO activity back to life after the 2008 financial crisis sparked a flight from risk.
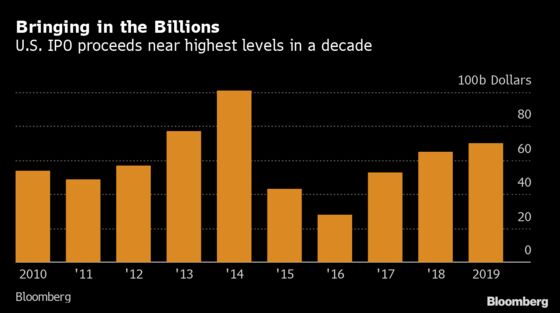
The welcoming market conditions and a fear of missing out drove about $600 billion of IPO issuance over the past ten years, according to data compiled by Bloomberg.
Here are some of the biggest themes in the past decade’s initial public offerings:
IPOs Lag the Market
Stocks that listed in the U.S. over the past 10 years are now trading 70% above their IPO prices on average, weighted by deal size, according to data compiled by Bloomberg. That trails the 190% rise in S&P 500 prices over the same period.
The end of the decade has not represented a departure from this trend. This year’s IPOs underperformed the S&P 500 by more than 50%.
Largest IPOs Outperform
The 2010s delivered some of the largest IPOs ever conducted, and such deals were typically rewarded.
Eighty-seven IPOs raised at least $1 billion each during the last decade. The basket has delivered significantly higher returns on average than smaller IPOs. These stocks are trading 92% above their offering prices, while IPOs worth less than $1 billion have returned an average of 57%.
The very largest IPOs are also among the very best performers. Alibaba Group Holding Ltd. is trading 215% above its 2014 offering price, for example, and a share of Facebook Inc. is worth 440% more than its 2012 IPO.
Of the 2010s IPOs that are still listed today, a majority are trading below their IPO prices. That’s mostly thanks to a flood of smaller debuts that failed to gain traction in the aftermarket.
But not all mega-deals have been winners. Recent duds include Uber Technologies Inc. and Snap Inc., two of the six largest IPOs conducted this decade. Both stocks are trading below their offering prices.
Thanks to deals like Uber, 2019 saw a departure from the trend of large IPOs outperforming. IPOs that raised at least $1 billion have fallen by an average of 5% from their offering prices.
Technology Reigns
No sector’s new listings have performed better than technology and communications over the past ten years. Listings from this space have risen 164% from their IPO prices on average, while debuts from all other sectors have jumped by just 38%.
Energy IPOs have delivered the worst returns this past decade. Such stocks are now trading 36% below their IPO prices on average.
And while the decade dominated by the FAANG group and new trillion-dollar market values unsurprisingly extended its success to tech in new issuance, 2019 was a departure. Software IPOs continue to outperform, but online services like Uber, Lyft Inc. and Fiverr International Ltd. underperformed.
IPO Investors Picking Winners
While IPOs are collectively lagging the market over the past decade, investors who participate in such deals have been a bit pickier. They have overall done a good job choosing winners by placing more aggressive orders.
IPOs that priced above the indicative range have delivered the best returns this decade -- rising 87% on average. Deals that priced within-range are second-best at 69%, while deals that priced below-range are performing the worst, rising just 60% on average.
Goldman, JPMorgan Lead in Market Share
Goldman Sachs, JPMorgan and Morgan Stanley have gotten the most business from this decade’s IPOs, according to Bloomberg league tables.
Goldman is credited with more than $40 billion of issuance, a 9.6% market share. JPMorgan and Morgan Stanley are close behind with 9.4% and 9.3% shares, respectively.
Among banks with at least a 1% market share, Cowen’s IPOs have performed the best. Its IPOs are trading 160% above their IPO prices on average. JPMorgan deals are trading 105% above their IPO prices, while Credit Suisse is in third place at 102%. The bank with the worst performing IPOs is Cantor Fitzgerald, whose deals are just 7.9% above their IPO prices on average.
To contact the reporter on this story: Drew Singer in New York at dsinger28@bloomberg.net
To contact the editors responsible for this story: Brad Olesen at bolesen3@bloomberg.net, Jeremy R. Cooke, Catherine Larkin
©2019 Bloomberg L.P.