Echoes of February Collapse Reappear in Friday Fear Gauge Inversion
One of Traders' Worst Friday Fears Realized as VIX Curve Inverts
(Bloomberg) -- The scariest Halloween costume imaginable pales in comparison to a Friday inversion of the VIX futures curve.
A severe sell-off in technology stocks has pushed the front-month VIX futures contract to a premium relative to the second-month contract.
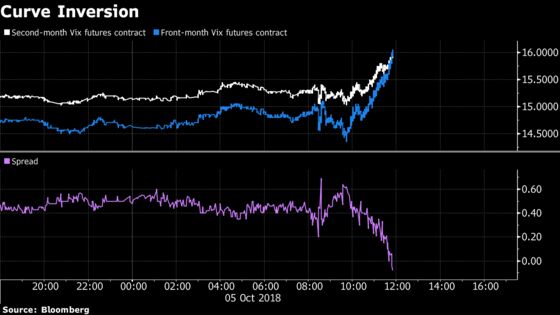
VIX futures are based off the Cboe Volatility Index, a measure of 30-day implied volatility for the S&P 500 Index that’s often called the “fear gauge.”
Typically, the curve is in contango -- that is, upward sloping -- because the outlook for U.S. equities is more uncertain over longer time periods than shorter ones. The historical pattern of realized volatility shows it’s prone to outsized spikes but generally trades in a modest range.
A curve that’s in backwardation -- the opposite of contango -- indicates traders are acutely concerned with the near-term outlook for equities. This structure also provides a tailwind to investors looking to go long volatility through exchange-traded products.
The same situation happened on a pair of inauspicious Fridays. The VIX futures curve inverted on Aug. 21, 2015 and Feb. 2, 2018.
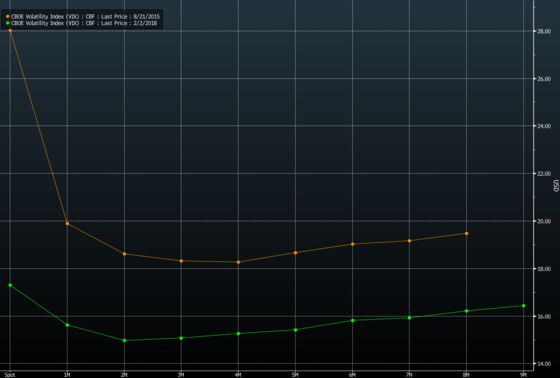
The S&P 500 Index fell 3.9 percent and 4.1 percent the following Mondays, respectively, its two worst sessions since 2011. The latter saw the biggest daily jump in the VIX Index on record, which led to the demise of exchange-traded funds that let investors bet on enduring market calm.
To contact the reporter on this story: Luke Kawa in New York at lkawa@bloomberg.net
To contact the editors responsible for this story: Jeremy Herron at jherron8@bloomberg.net, Randall Jensen, Andrew Dunn
©2018 Bloomberg L.P.