Half-Baked Sell-Off Has Traders Worried the Worst Is Yet to Come
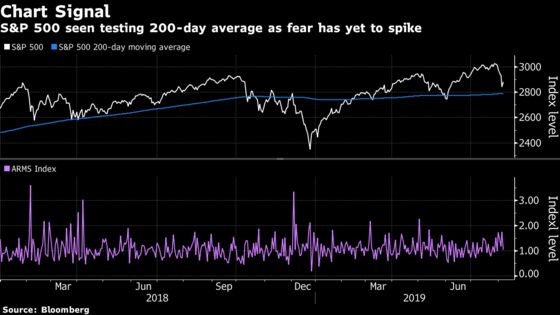
The panic was missing in a volume-based market breadth measure that plots up and down moves and adjusts them for intensity.

(Bloomberg) -- For the first time in more than a week, it was good to be an equity bull.
Even as U.S. stocks tumbled, the strategists saw indicators that suggested selling never reached levels of panic hit in May and December. The lack of a washout in sentiment bolstered investors who say a deeper pullback looms because almost all the equity gains this year have been driven by valuation expansions, not profit growth.
“As ugly as yesterday’s price and breadth data was, most of the conditional elements that are typically present at trading lows are still absent,” said Russ Visch, a technical analyst with BMO Capital Markets. It’s “heavily negative, but not capitulative,” he said.
The sense of panic was missing in a volume-based market breadth measure that plots up and down moves and adjusts them for intensity, known as the Arms Index or TRIN. It closed at 1.74, not even approaching levels hit when trade angst sent equities tumbling in May and December. Among traders and portfolio managers Bloomberg surveyed Monday, consensus emerged that selling in equities was orderly.
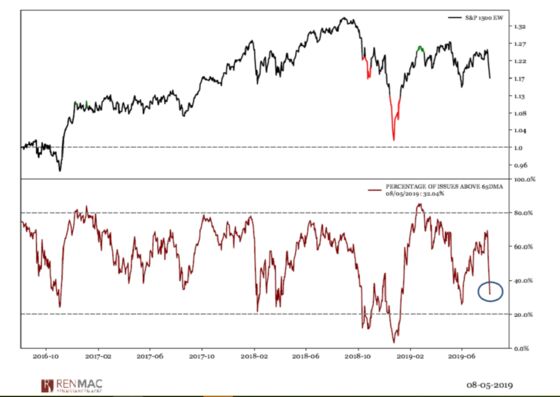
Tuesday’s snapback also wasn’t entirely unexpected. In 98 prior sell-offs of 3% in the past six decades, stocks rose the next day 60% of the time, according to Citigroup data. With panic missing Monday, the biggest gain for the S&P 500 in two months the next day isn’t enough to set the stage for sustained gains, according to Renaissance Macro Research.
The firm points to percentage of shares that traded above their 65-day moving average in recent session. It has held near 30% -- far from the threshold of 20% that the firm considers extreme. This indicator and the TRIN measure “have further work to do before we feel comfortable in calling for a low,” said Jeff deGraaf, Renaissance Macro’s co-founder.
Worried chart watchers also keyed on moving averages. The S&P 500 ended at 2,882, unable to climb above its 100-day mean of 2,901, suggesting weakness. The 200-day average looms as a more ominous beacon, some 100 points below where the index closed Tuesday.
While bears have been foiled countless times during the 10-year bull run, calls that this time is different have grown since the Federal Reserve damped hopes for a prolonged easing cycle and President Donald Trump slapped new tariffs on China last week. The S&P 500 fell 6% in six days, marking the third-fastest retreat of at least 5% from a peak since 2009.
Even if the drop resumes and takes the index to it 200-day average, bulls have reason to remain confident, judging by by past routs similar to Monday’s. Since 1962, there have been 348 times when the S&P 500 fell more than 2% in a day, according to Citigroup. Twenty days later, the measure averaged a gain of 1.4%. Over 60 days, the advance was 3.3%.
“It’s possible that a 3% drop is just an overreaction,” said Walter “Bucky” Hellwig, a senior vice president at BB&T Wealth Management in Birmingham, Alabama. “It doesn’t mean that it’s all clear, but rates are low, the economic backdrop, at least in the U.S., is far from terrible. People waiting for a pullback might be using the opportunity to buy the dip.”
--With assistance from Gregory Calderone.
To contact the reporters on this story: Lu Wang in New York at lwang8@bloomberg.net;Elena Popina in New York at epopina@bloomberg.net
To contact the editors responsible for this story: Jeremy Herron at jherron8@bloomberg.net, Rita Nazareth
©2019 Bloomberg L.P.