Here Are Three Crazy Market Statistics on a Wild Day of Trading
To say that U.S. stocks trading has been odd this week seems like an understatement.

(Bloomberg) -- To say that U.S. stocks trading has been odd this week seems like an understatement.
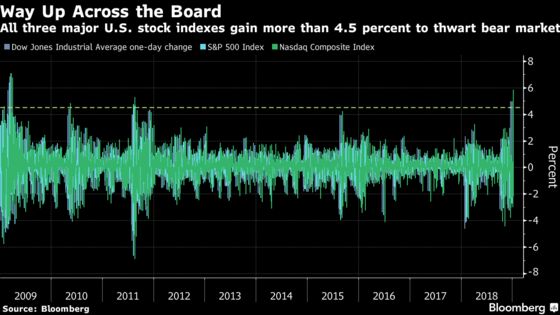
All three major U.S. indexes gained at least 4 percent on Wednesday. That’s the first time that’s happened since 2011. The Dow Jones Industrial Average and the S&P 500 Index both came a hair shy of topping 5 percent.
The Dow registered another oddity: Its performance perfectly mirrored its last trading day. On Monday, all 30 member stocks finished in the red. Today, all green. That’s the first time that’s occurred since 2015 and just the 10th time since 2000.
And finally, Wednesday was the first time ever, according to data compiled by Bloomberg that stretches back to 1990, in which more than 500 stocks in the S&P 500 finished positive, with 99.8 percent of stocks advancing. (No typo: There are 505 stocks in the S&P 500.) The previous record, at least as far back as 28 years ago, was 99.6 percent in 2011, or 498 stocks out of 500.
Gold and copper producer Newmont Mining Corp. was the lone loser on Wednesday.
--With assistance from Nancy Moran and Jeremy Herron.
To contact the reporter on this story: Brandon Kochkodin in New York at bkochkodin@bloomberg.net
To contact the editors responsible for this story: Joe Weisenthal at jweisenthal@bloomberg.net, Bob Ivry
©2018 Bloomberg L.P.