Four Charts That Show How Erratic the Stock Market Has Become
Four Charts That Show How Erratic the Stock Market Has Become
(Bloomberg) -- Stocks are plunging after the sudden burst of optimism drove a furious rally in the S&P 500 late Friday turned into one of the worst days since the financial crisis.
Investors quickly found themselves bracing for the biggest decline since December 2008 as the coronavirus outbreak continued to worsen over the weekend and Saudi Arabia started an oil price war. The benchmark for U.S. equities was down 7% Monday afternoon, after a 7% plunge at the start of trading triggered a trading halt.
A price war in oil “is one of the three worst possible shocks for markets engulfed by the Covid-19 crisis,” with a lockdown of parts of the U.S. economy and a second wave of virus infections in China being the other two, said Jeff Schulze, investment strategist at ClearBridge Investments. The Federal Reserve meeting in March may bring an additional 50 basis point cut to interest rates as the economic situation continued to deteriorate, he said.
Here are four charts that show how erratic and uncertain the market has gotten:
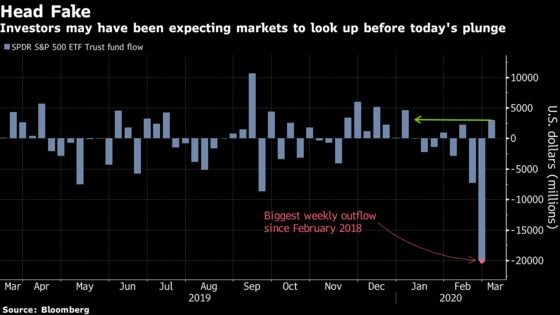
The SPDR S&P 500 ETF Trust was showing some signs of life last week, posting its first net inflow since late January after investors pulled more than $20 billion from it in the prior five trading days. Shares in the $261.7 billion fund, plunged as much as 8.1% on Monday.
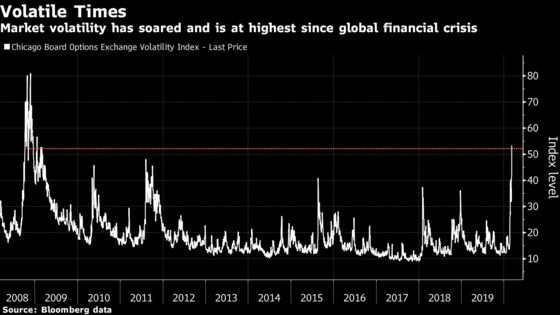
The Cboe Volatility Index, which through most of February had traded around its five-year average of 15, is now more than triple that level, having surged to the highest since the global financial crisis in 2008. The index uses options prices to track the 30-day implied volatility for S&P 500 stocks.
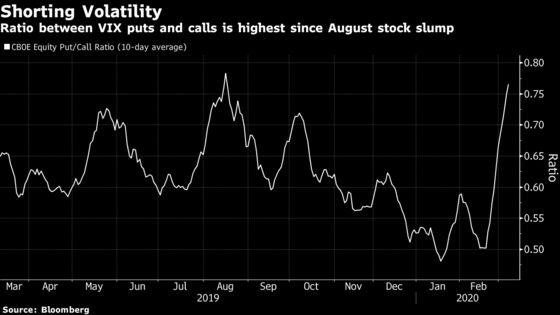
At the same time, bets that volatility will subside have been on the rise. The ratio of puts to calls on the VIX has climbed to the highest level since last August’s market slump.
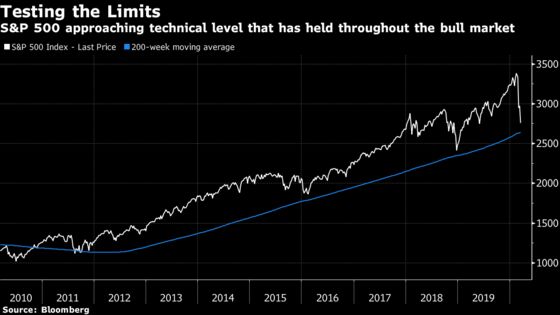
The S&P 500’s virus-fueled wipeout has already landed it below most points that technical analysts had pegged as potential support levels. The extreme volatility has Evercore ISI’s top chartist Rich Ross warning that index is poised for a drop to 2,640, its 200-week moving average. Failure to hold that level “will call into question the integrity of the 11-year bull trend and open the door to a test of the Q4 ’18 lows around 2,396/2,350 (-30% from the top),” Ross wrote on Monday.
To contact the reporters on this story: Richard Richtmyer in New York at rrichtmyer@bloomberg.net;Esha Dey in New York at edey@bloomberg.net
To contact the editors responsible for this story: Courtney Dentch at cdentch1@bloomberg.net, Richard Richtmyer, Randall Jensen
©2020 Bloomberg L.P.