Faang’s Gains Are Nothing Special, Quant Study Says
Faang’s Gains Are Nothing Special, Quant Study Says
(Bloomberg) -- Many Wall Street careers have been built touting the exceptional capacity of Big Tech stocks including Amazon.com Inc. and Alphabet Inc. to outrun everything else in the market.
Yet a recent study from the Singapore Management University argues the superpower of the Faang cohort is exaggerated.
The bulk of their gains since 2013 came thanks to a broader market appetite for large companies and those with strong earnings growth, according to Roger K. Loh, an associate professor of finance who studied how investment factors influence returns. The intrinsic magic or otherwise of the Faang label -- which includes the company formerly called Facebook Inc., Apple Inc. and Netflix Inc. -- has little to do with it.
Loh found that the group’s impressive total returns, at 2.6% a month, dwindled to an actual outperformance of as low as 0.4% when controlling for the impact of favorable trends in the rules-based world of factor investing.
“If we account for the fact that Faang stocks belong to the large-cap group (size factor) and the growth-stocks group (value/growth factor), the majority of the abnormal performance post-2013 can be explained,” Loh said in an interview. “Their standout performance is less ‘standout’ once you see that stocks with the same styles were also standout in the post-acronym period.”
The good news: It suggests active managers struggling with the Faang oligarchy can match or outperform benchmarks by buying other stocks similarly powered by the size and growth factors.
Also lifting the Faangs, Loh found, is the Covid-19 outbreak, an event that has exacerbated the appeal of companies catering to stay-at-home demand. Excluding the pandemic period, their above-factor alpha weakened further.
To Faang devotees whose criteria of success is price gains, it may not matter much what exactly is driving their share returns. Yet for managers whose performance is tied to the S&P 500, it really does matter. The growing weight of the Faang group in the index has created headaches for active funds who have underperformed because of their broader market exposures.
Whether because of concern over stretched valuations or regulatory strictures, these managers have been chronically underweight the tech cohort.
The paper, which crunched data from February 2013 to August 2021, provides hope for them in the following way: If Big Tech outperformance is increasingly determined by quant factors, then investors can net big returns by holding a diversified portfolio of stocks with similar growth bets.
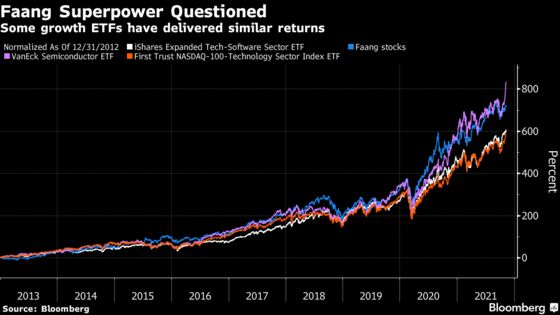
For example, the VanEck Semiconductor exchange-traded fund has posted more than 900% since the start of 2013 versus around 720% for the Faang. The First Trust NASDAQ-100-Technology Sector Index ETF and the iShares Expanded Tech-Software Sector ETF have delivered around 650% and 625%, respectively.
“This provides greater diversification and lower volatility and can deliver similar returns compared to choosing just a few prominent stocks in that style,” Loh said without naming any specific ETFs. “Fund managers are evaluated based on the alpha they generate. And if these alphas are increasingly determined using multi-factor models such as the models studied in the paper, the ultimate abnormal performance that should matter is a multi-factor alpha.”
From 2013 onwards, about one in ten members of the Russell 1000 growth index has beaten the Faang bloc. Enphase Energy Inc., Horizon Therapeutics Public Ltd. and 11 other stocks are up at least 3,000%.
The term FANG is believed to have been coined by CNBC’s “Mad Money” host Jim Cramer in 2013 as a way to capture the investing theme of buying tech leaders with accelerating momentum in share prices. Other market watchers quickly latched on to the phrase as the quartet’s dominance continued to expand. As Apple grew relentlessly, it was added in 2017 to create the Faangs.
Before 2013, the bloc’s return was driven far more by company-specific traits than quant factors, according to Loh who specializes in asset pricing and behavioral finance. As a result, the above-factor return was robust. But at the very moment when the Faang term was popularized, their returns driven by idiosyncratic forces likely peaked. To Loh, the pattern is consistent with other academic work showing darling stocks tend to fade after widespread recognition.
Faang Correlation
Relatedly, the study found that there are increased co-movements, or betas, among Faang stocks since 2013.
“Narratives drive markets,” Corey Hoffstein, chief investment officer at Newfound Research, said by phone. “These stocks actually all became more highly correlated with each other, perhaps suggesting that people actually started trading them in a basket because the acronym was developed.”
In the paper, Loh also examined whether the Faangs themselves have become a factor to separate winners from losers in the rest of the market. Ranking every company based on sensitivity to the Faangs, he calculated the return gap between stocks with the highest and lowest betas.
“I find no reliable spread between the extreme Faang beta quintiles,” the academic wrote. “Hence, investors do not treat covariation with Faang stocks as a type of risk that deserves compensation.”
©2021 Bloomberg L.P.