Equities Are on ‘Borrowed Time’ as Recession Signal Nears Inversion
Inversion of 2s10s curve typically precedes stock market peaks.

(Bloomberg) -- Even as U.S. equities rally on the latest trade war developments, strategists at Bank of America Corp. are turning to a trusted recession indicator to figure out just how much time the stock bull run has left.
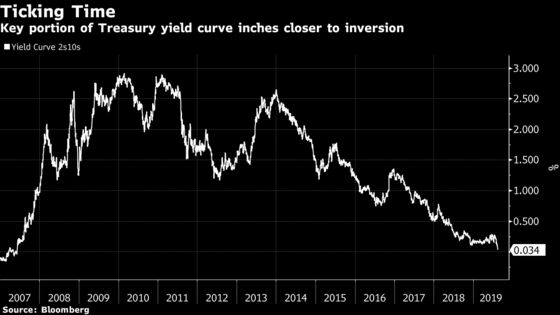
They’re focusing on the spread between 2- and 10-year Treasury yields, whose inversion has tended to precede recessions in the past. On Tuesday, the 10-year notes traded with a yield less than 2 basis points higher than 2-year notes, the narrowest level since 2007. One closely watched portion of the curve is already deeply inverted, but warning signs are growing as another flip nears.
“The 3-month T-Bill vs the 10-year T-Note curve has already inverted and the risk is that the 2s10s curve inverts as well,” Bank of America Merrill Lynch strategists including Stephen Suttmeier, wrote in a note to clients. “The equity market is on borrowed time after the yield curve inverts.”
An inversion in the spread between 2- and 10-year Treasury yields has a pretty strong track record predicting recessions and stock market peaks, the issue is more so timing. The signal from the bond market has preceded every one of the last seven recessions, according to Bank of America, and nine out of the last 12.
Deriving direct implications for how long one should remain in the stock market though is a murkier ordeal, since equities have peaked anywhere from two months to two years after an inversion. Strategists at the bank found that in six of the last 10 times the yield curve inverted, the S&P 500 rolled over within three months. But for the other four instances, the gauge didn’t top out until at least 11 months passed.
Also conflating the decision for when investors should bail on equities is the presence of a “meaningful last gasp rally.” Sure, the S&P 500 has fallen an average of roughly 5% in the immediate aftermath of an inverted yield curve, but the comeback has been stronger, rallying almost 17% on average in the 7 months after the initial negative reaction, according to Bank of America.
The S&P 500 rose 1.7% as of 11:15 a.m. after the U.S. announced they would delay 10% tariffs on certain Chinese goods until December, instead of implementing them at the start of September. Earlier this month, the U.S. stock benchmark suffered its worst period of the year in the wake of growing U.S.-China trade tensions and global growth concerns.
But even with slight improvement in the outlook for trade between the two world superpowers, the bond market is signaling risks remain.
“The typical pattern is the yield curve inverts, the S&P 500 tops sometime after the curve inverts and the U.S. economy goes into recession six to seven months after the S&P 500 peaks,” the strategists wrote.
To contact the reporter on this story: Sarah Ponczek in New York at sponczek2@bloomberg.net
To contact the editors responsible for this story: Jeremy Herron at jherron8@bloomberg.net, Dave Liedtka, Rita Nazareth
©2019 Bloomberg L.P.