Countdown to Catastrophe? What the Yield Curve Means for Stock Bull Markets
Countdown to Catastrophe? What the Yield Curve Means for Stock Bull Markets
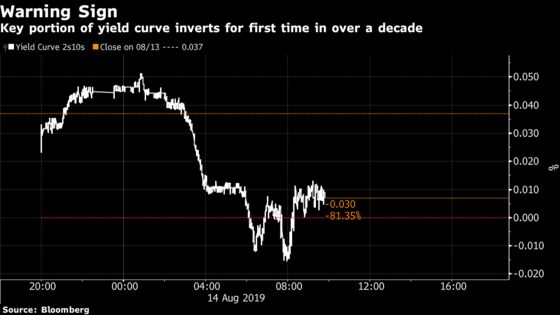
(Bloomberg) -- A key portion of the U.S. Treasury yield curve has inverted, an ominous sign for the economy and the stock market. But what investors should do about it now is a complicated question.
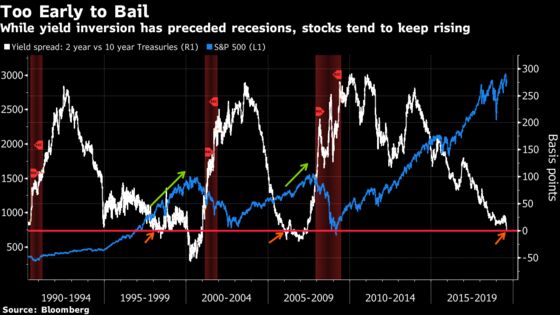
Looking at history, after the spread between two- and 10-year Treasury yields first turned negative 10 times going back to 1956, the S&P 500 topped out anywhere from two months to two years later, according to data compiled by Bank of America strategists. Often, bailing immediately after the signal flashed meant missing out on double-digit gains.
“It’s a great recession indicator. It just happens to work with a lag,” Tony Dwyer, Canaccord Genuity’s chief market strategist, said by phone. “Acting on it now is inappropriate.”
For the first time since 2007, the rate on 10-year Treasury notes dipped below those of 2-year notes Wednesday, sounding alarms across global financial markets. The signal from the bond market has preceded each of the last seven recessions.
Six of the last 10 times the yield curve inverted, the S&P 500 rolled over within three months. In the other four, the gauge didn’t top out until at least 11 months passed, data compiled by Bank of America show. The wide range of possibilities muddies the waters for stock investors that consider the yield curve when allocating portfolios.
The S&P 500 “can take time to peak after a yield curve inversion,” strategists at the bank, including Stephen Suttmeier, wrote in a note to clients this week. But ultimately, “the equity market is on borrowed time after the yield curve inverts.”
If you took the yield curve’s first inversion prior to the 2008 financial crisis as a signal to sell, you were probably glad. Yes, you missed a nearly 25% advance between Christmas 2005 and the top of the bull market 22 months later. But just five months after that, your gain had shrunk to 4%. Holding on through the whole bear market left you gutted -- down 46%.
Then again, five years later you were back to even. Ten years later you were sitting with a 64% gain.
It’s a different story for the initial inversion that came before the dot-com bubble burst. The spread turned negative briefly in May 1998, and the S&P 500 went on to rally almost 40% through the bull market peak. While that gain would’ve turned to a loss of 30% just 2 1/2 years later at the market bottom, you still would’ve seen double-digit negative returns five years after the first signal.
Still, timing the market isn’t easy and it can be tempting to hold on, especially since the S&P 500 usually enjoys a last gasp rally after the initial yield curve inversion. Sure, the S&P 500 has fallen an average of roughly 5% in the immediate aftermath of an inverted yield curve, but the comeback has been stronger, rallying almost 17% on average in the 7 months after the initial negative reaction, according to Bank of America. In Asia, stocks were sold off on two of the last three inversions.
Major equity benchmarks plunged Wednesday after key parts of both the U.S. and U.K. yield curves inverted, stoking further concerns over weak global growth. The S&P 500 fell 2.9% while the Dow Jones Industrial Average lost 800 points. U.S. 30-year Treasury yields also fell to record lows. Stocks in Japan were down by almost 2% at 10 a.m. in Tokyo on Thursday.
At Crossmark Global Investments in Houston, which manages $5 billion, the team is keeping an eye on the curve, but not yet taking the signal too seriously. Victoria Fernandez, the firm’s chief market strategist, notes that the consumer is still strong, and until retail sales data or other indicators start to deteriorate, she’s not worried a recession is imminent.
Still, rates on longer-dated bonds falling to record lows is concerning, and the stickiness of the latest yield curve inversion is well worth paying attention to, she said. “If we had a true inversion of the yield curve that stuck for a while -- if we saw an inversion go for a quarter and those consumer numbers start to come down as well, we see that GDP start to contract, if we see that, then maybe we add a little bit of cash.”
To contact the reporters on this story: Sarah Ponczek in New York at sponczek2@bloomberg.net;Lu Wang in New York at lwang8@bloomberg.net
To contact the editors responsible for this story: Jeremy Herron at jherron8@bloomberg.net, Chris Nagi
©2019 Bloomberg L.P.