Clock on the Wall Says It's Past Midnight in These Stock Beacons
Clock on the Wall Says It's Past Midnight in These Stock Beacons
(Bloomberg) -- For stock bears waiting for the $20 trillion rally to unravel, it’s getting late. They see a lengthening list of indicators that show time is running out on the longest bull market ever recorded.
The two largest world superpowers are fighting a trade war while the Federal Reserve contemplates rate cuts in the face of slow economic growth and elusive inflation. Bonds continue to rally, with the 10-year once again falling below 2% -- the bearish yin to equities’ yang. There’s more, too.
“We have this weird combination of U.S. stocks at all-time highs, very low forward interest rates, and we see signs of bubbles kind of popping out in all different places,” Connor Browne, portfolio manager for New Mexico-based Thornburg Investment Management, said in an interview at Bloomberg’s New York headquarters. “There are lots of reasons to be worried. Something has to give and there’s some chance that it’s stocks.”
From consumer confidence, to earnings and jobless claims, below are some of the things chart watchers say might have seen their peak.
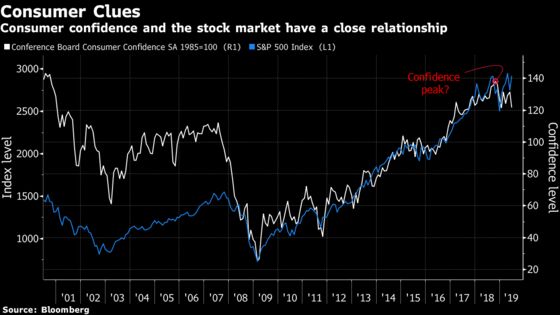
Fading Confidence
Wrinkles are starting to show in the faces of consumers. Conference Board data showed sentiment fell in June to the lowest since 2017 on Tuesday. At the same time, survey respondents turned bearish on U.S. stocks at one of the fastest paces since the global financial crisis. The deterioration marks a swift turn from similar data in May that marked the best sentiment in 15 years.
To Michael Shaoul, chief executive officer at Marketfield Asset Management LLC, there’s reason to believe consumer confidence peaked back in October 2018. That “represents a warning for the overall investment cycle given that confidence measures historically peak fairly close to the overall bull market,” he wrote in an email.
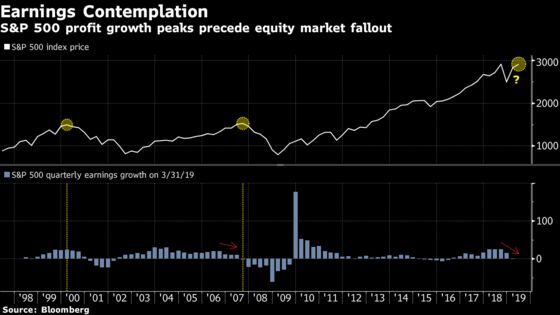
Slowing Earnings Growth
It’s one of Wall Street’s big dramas. Did earning growth peak as effects from President Trump’s tax overhaul sunk in? Companies in the S&P 500 posted three straight quarters of 25% profit growth last year. This year, analysts expect earnings for the benchmark to come in at $166.20 a share. Sure, that’s still a gain of 4% from last year, but down from the near 8% increase that was expected in January.
It remains true that peak earnings growth doesn’t necessarily spell the end to the stock market cycle. Richard Bernstein Advisors research has shown that since 1980, earnings growth has peaked 11 times, and in the years following 10 of those periods, S&P 500 returns were positive.
Still, the direction of earnings is closely intertwined with stock market returns. In 2000, S&P 500 profit growth topped out in the same quarter that marked highs for the index. When the benchmark rolled over in 2007, earnings gains had been waning for three quarters. Profits may not be doomed to fall this year, but they’re likely not going to get much better, either.
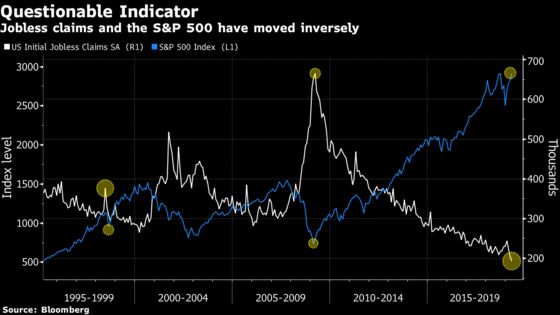
Jobless Claims Bottom?
It’s looking possible jobless claims hit a trough for the current economic cycle. In April, weekly claims dropped to 192,000, the lowest number since 1969, and the count has been higher ever since. Estimates for this Thursday’s release call for 220,000, above the last reading.
If the pattern continues, investors should take note. Jobless claims and the S&P 500 have moved inversely since the turn of the century, with bottoms in the data coinciding with peaks for stocks. Andrew Zatlin of SouthBay Research Inc., the top Bloomberg-ranked jobless claims forecaster, sees “pre-recessionary signals” in the data.
“When Initial Claims are the same as the prior year, it’s a sign that businesses have stopped growing,” he wrote in an email. “In the year to date (24 weeks), most weeks have been at or above the prior year’s nominal levels.”
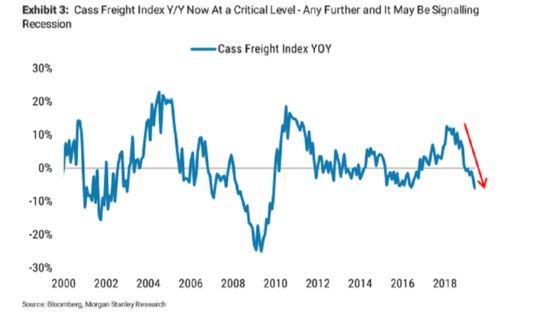
Movement of Goods
Strategists at Morgan Stanley often cite a more unconventional index as a sign off worry -- the Cass Freight Index, which in essence measures the flow of goods through shipments. The gauge recently fell 6.5% year-over-year and now stands at a “critical level,” according to the firm. If it slips any further, the index may be signaling a recession, strategists led by Mike Wilson warned.
In the most recent report, Cass Freight said, “We see the shipments index as going from ‘warning of a potential slowdown’ to ‘signaling an economic contraction.”’
--With assistance from Olivia Rinaldi and Vildana Hajric.
To contact the reporter on this story: Sarah Ponczek in New York at sponczek2@bloomberg.net
To contact the editors responsible for this story: Jeremy Herron at jherron8@bloomberg.net, Chris Nagi
©2019 Bloomberg L.P.