Bounce Implodes and Chart Jocks See an Ugly Route for Stocks
Results from Amazon, Alphabet are weighing on tech sentiment, pushing an ETF-tracking Nasdaq 100 to its worst plunge in 7 years.

(Bloomberg) -- A single-session reprieve has vanished in equities and now technical analysts who warned against chasing yesterday’s bounce are looking prescient. Alarmingly so.
Disappointing results from Amazon.com Inc. and Alphabet Inc. squashed sentiment, pushing the Nasdaq 100 down as much as much as 3.7 percent to below its close Wednesday, when it fell the most in seven years. The S&P 500 tumbled 2.5 percent as of 10:49 a.m. in New York.
The unlikelihood of this week’s lows holding were flagged in a series of notes Thursday as chart watchers saw scant evidence that losses had intensified to a point where every seller was exhausted.
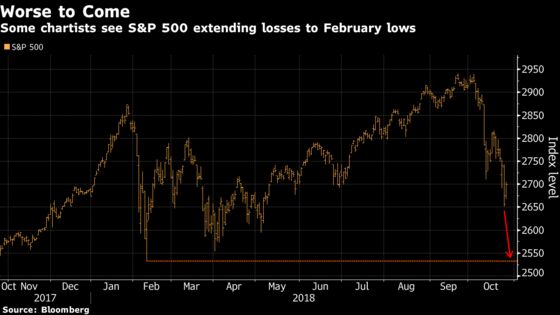
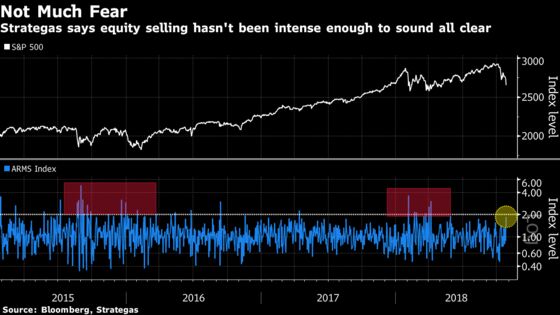
As steep as the plunge has been -- and from its Sept. 20 record, the S&P 500’s low today represented a 10 percent correction -- indications of panic that usually mark bottoms have been missing. That’s a sign to Chris Verrone, head of technical analysis at Strategas Research Partners, that the worst is yet to come.
Jeff deGraaf, Renaissance Macro Research’s co-founder, shared the caution, predicting that the S&P 500 Index will revisit its 2018 lows -- that is, fall an additional 5 percent from its levels yesterday.
“Enough questions have been asked regarding the current state of the market and eagerness to play the washout as to suggest it’s still too soon to anticipate a meaningful low,” deGraaf wrote in a note to clients. “We’d rather exert patience and await a high probability event than exhibit capriciousness and get too cute.”
The S&P 500 is poised for its worst month in eight years. Believe it or not, though, while the trip down has been persistent, few sessions smacked of climax selling to hardcore chartists.
While not embraced by everyone, technical analysis operates on the principle that price patterns reveal psychology, showing points in the market, for instance, where past decisions to buy become money-losers. A case could be made that it was having an impact on stocks Thursday, with the S&P 500 bouncing back to around 2,700, a level where declines in May and June ceased.
Something called the volume-based market breadth indicator plots up and down moves and weights them for intensity. The gauge, also known as the Arms Index or TRIN, has stayed below 2 this month, failing to surpass the threshold that Strategas considers a sign of indiscriminate selling.
In the options market, trader anxiety has been absent, too. The 5-day average of the CBOE put/call ratio had fallen short of 95th percentile readings until Wednesday, in stark contrast with past corrections where investors flocked to put options to hedge against losses.
“Put volume was finally elevated and the last 90 minutes of the Wednesday’s session certainly had a ‘sell what you can’ tone to it,” Verrone wrote in a note to clients. “This is a start.”
By his count, the February pullback involved six days with the put/call ratio in the 95 percentile or higher, while the bottoming process during late 2015 and early 2016 saw 15 similar days.
Technical damage has been done and further losses may be in store, according to Rob Ginsberg at Wolfe Research. As the monthlong carnage unfolded, the S&P 500 pierced through its moving average over the past 50 weeks and broke below a trendline established since early 2016. Now, a longer-term support is in danger as the index sits right on the uptrend line that’s been in place since the bull market started in March 2009.
To contact the reporter on this story: Lu Wang in New York at lwang8@bloomberg.net
To contact the editors responsible for this story: Jeremy Herron at jherron8@bloomberg.net, Chris Nagi
©2018 Bloomberg L.P.