Bond Market Turns to Technical Roadmap to Trade Treasuries Rally
Bond Market Turns to Technical Roadmap to Trade Treasuries Rally
(Bloomberg) -- For all the angst over the rout in risky assets, the rally in Treasuries has been relatively limited, leaving traders looking at technical indicators to help divine the road ahead.
Haven buying amid the slide in stocks and doubts about the pace of Federal Reserve rate hikes next year have combined to drive the benchmark 10-year yield down to about 3.05 percent, from a 7-year high of 3.26 percent set last month. Yet it’s only the lowest since September, which was also the last time it was below 3 percent. And moves in traditional havens such as gold and the yen were relatively muted Tuesday even as the S&P 500 was near correction levels.
Granted, the fundamental picture may be making it tough for bonds to advance, barring further global developments that spur a fresh flight to safety. Growth is merely slowing from an unsustainable pace reached in the second and third quarters, according to Bloomberg Economics. And Treasury issuance has surged in 2018 as the government finances worsening deficits and shrinking Fed debt purchases.
“To break below 3 percent we need the geopolitical risks from Brexit to Italy to really snowball,” said Ben Emons, chief economist at Intellectus Partners LLC. “We are not at that point, just yet. And overall this year the Treasury market has been facing a lot of supply and the Fed so far hasn’t held back.”
So against that backdrop, technical analysts are focusing on a few key levels to determine if Treasuries are breaking out and driving yields into a new, lower range.
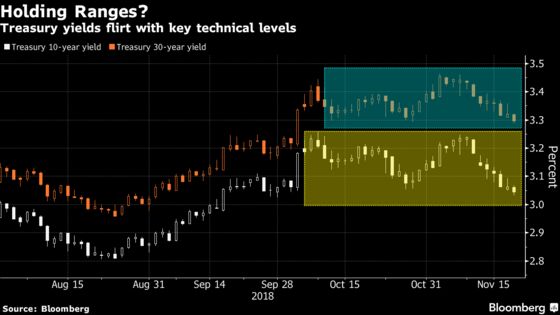
Marty Mitchell, an independent strategist who’s been charting Treasuries since the 1980s, says the decline in 10-year yields to as low as 3.0337 percent Tuesday puts a target of 3.025 percent to 3.015 percent into view -- key technical levels from June through September.
Yet this area “should bring out some sellers, so look for resistance (yield support),” he wrote in a note to clients. If yields prove to then hover around there for a few sessions, it’s a signal that the 3.025 percent to 3.26 percent range “will remain intact.”
Should the 10-year yield bust lower and break through 3 percent, Jon Hill, a rates strategist at BMO Capital Markets, wrote in a note Tuesday that the 200-day average of 2.948 percent would loom as a target “as the market recalibrates below that psychological threshold.”
As for the 30-year yield, at about 3.3 percent it’s just below its average of the past two months. If key support presently being tested at 3.293 percent is broken on a closing basis, then a move to the 3.245 percent level is likely, according to Mitchell.
--With assistance from Chris Middleton.
To contact the reporter on this story: Liz Capo McCormick in New York at emccormick7@bloomberg.net
To contact the editors responsible for this story: Benjamin Purvis at bpurvis@bloomberg.net, Mark Tannenbaum, Elizabeth Stanton
©2018 Bloomberg L.P.