A Decade Looking Back at Emerging-Market Assets and China’s Rise
It was the decade when Chinese markets came of age, moving from a bit player to center stage in stocks.

(Bloomberg) -- It was the decade when Chinese markets came of age, moving from a bit player to center stage in stocks, bonds and currencies for developing nations.
And as China expanded, so did emerging markets as a whole, taking an ever larger share of global trading. The share capitalization of developing nations almost doubled, bond issuance tripled and trading in their currencies rose to more than a quarter of the global total.
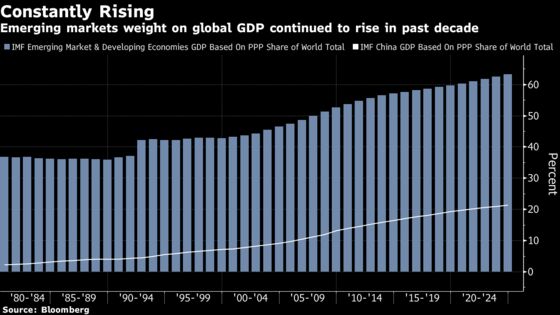
Yet the asset class still isn’t pulling its economic weight in global markets. The International Monetary Fund estimates emerging and frontier markets are responsible for about 59% of global gross domestic product, a share that is expected to rise to 63.3% in 2024. Emerging markets still have a lot of room for growth.
Here are eight charts to show the increasing role of developing nations:
Stocks
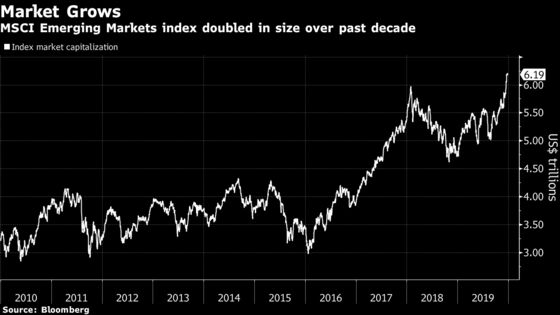
The market capitalization of the MSCI Emerging Markets index, the benchmark for developing-nation stocks, almost doubled in the past decade, reaching an all-time high of $6.2 trillion.
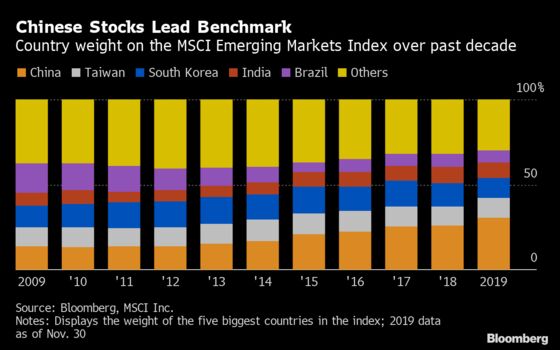
Not only the size of emerging-market companies rose but also they’re becoming more important for the global market. The weighting of developing nations in the MSCI World index rose to 12% in April 2019 from 6.8% in 1997, according to a MSCI Inc. report.
They can thank China. The weighting of the Asian giant in the MSCI emerging market index leaped to 30.3% from 13.6% a decade ago.
Currencies
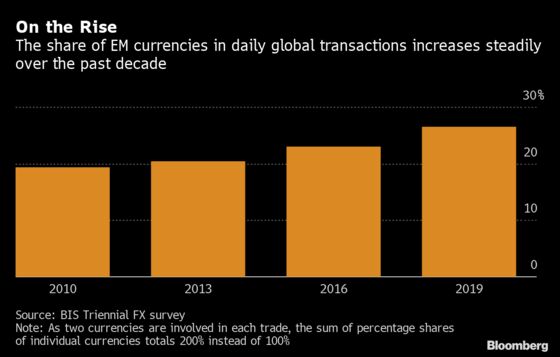
The share of emerging-market currencies in daily global transactions, on a net-net basis, increased to 26.5% in April from 19.4% in 2010, according to a survey from Bank for International Settlements conducted once every three years. Growth is also accelerating. Their share rose by 3.5 percentage points between 2016 and 2019, compared with 2.6 points from 2013 to 2016 and 1 percentage point in the previous three years.
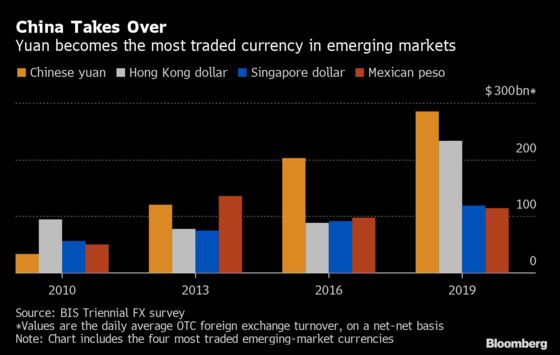
This expansion was almost exclusively driven by Asia. Among 28 emerging and frontier-market currencies included in the survey, only five gained share in global daily foreign exchange transactions over the past decade -- the Chinese yuan, the Hong Kong dollar, the Singapore dollar, the Indian rupee and the Mexican peso. The Chinese yuan became the most traded currency in developing nations.
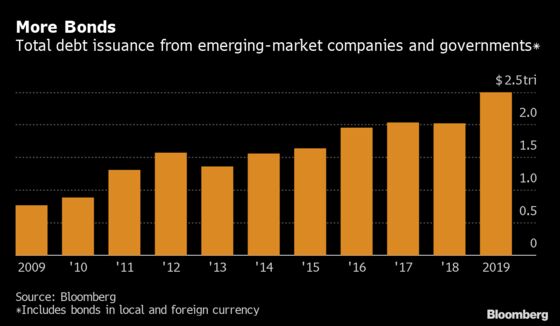
Bonds
The number of yearly bond sales by emerging-market companies and governments in local and foreign currency almost tripled over the past decade, reaching 15,270 deals in 2019, according to data compiled by Bloomberg. In volume, debt sales reached $2.5 trillion in 2019, 3.2 times more than the $769 billion issued in 2009.
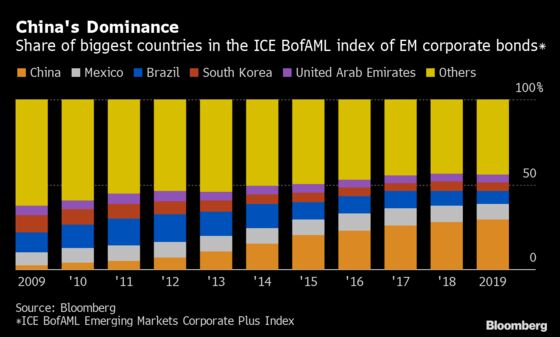
Once more, China dominated the expansion and became the biggest contributor to benchmark bond indexes. Chinese companies currently account for 29.5% of the ICE BofAML Emerging Markets Corporate Plus Index, up from just 2.7% at the end of the last decade. The second and third biggest countries in the gauge are Mexico and Brazil, with Mexico’s stake rising to 9.2% from 7.5% and Brazil’s falling to 7.7% from 11.5%.
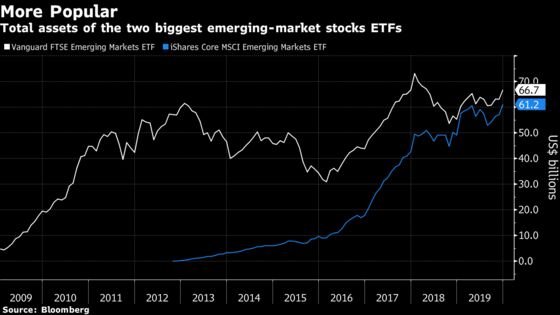
ETF
The exchange traded fund industry has seen explosive growth in the past decade. The biggest developing nation stocks ETF, the Vanguard FTSE Emerging Markets ETF, known as VWO, had around $20 billion in assets 10 years ago, less than a third of the $67 billion it current holds. The iShares Core MSCI Emerging Markets ETF, known as IEMG, didn’t even exist until 2012 and rapidly accumulated $61 billion in assets to become the second largest of the industry.
No prizes for guessing which country led growth. Out of the 49 U.S. listed ETFs dedicated to Chinese stocks tracked by Bloomberg, 43 were created over the past decade. The country is now the most important in the industry with $85 billion in Chinese assets under emerging-market ETFs listed in the U.S. That is about 30% of the $280 billion total, which includes both broad emerging-market funds and the ones that focus on a specific country, region or sector within developing nations, according to data compiled by Bloomberg.
Economic Growth
The growing market share of emerging markets still pales into insignificance next to their economic weight. The IMF estimates they will be almost two thirds of the global economy in five years. Emerging markets look destined to play an ever bigger role in markets.
--With assistance from George Lei.
To contact the reporter on this story: Aline Oyamada in Sao Paulo at aoyamada3@bloomberg.net
To contact the editors responsible for this story: Carolina Wilson at cwilson166@bloomberg.net, Philip Sanders, Justin Carrigan
©2020 Bloomberg L.P.