S&P 500 Charts Are So Bad Even Bulls Are Looking to Adjust Bets
The technical backdrop for stocks is deteriorating so much that some bulls are even preparing to change their outlook.

(Bloomberg) -- The technical backdrop for stocks is deteriorating so much that some bulls are even preparing to change their outlook.
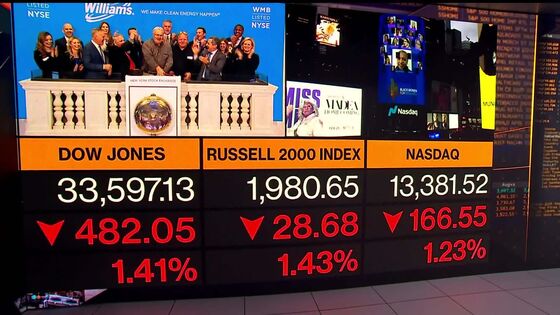
That’s the plight facing strategists who are now forced to price in escalating tensions between Russia and Ukraine on top of rising oil, surging inflation and a Federal Reserve that’s on the verge of raising interest rates. In the face of the escalating geopolitical tensions, the S&P 500 fell for a third straight day on Tuesday. It’s now down more than 10% from its record high at the start of the year, signaling a technical correction.
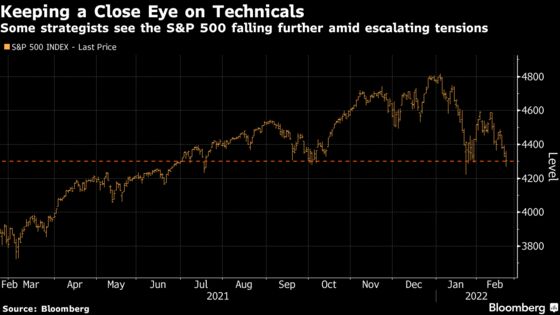
The drops pushed the gauge below its 200-day moving average in recent days, a bearish omen suggesting it could slide toward a much lower floor. The S&P 500 is “living on the edge of support” around the 4,300 level, according to Craig Johnson, chief market technician at Piper Sandler & Co.
A breach below that “would validate a lower low following a lower high, checking the classification box for a downtrend and forcing us to reevaluate our bull market thesis,” he wrote. Though he’s sticking with his 5,150 year-end price target for now, he says “the technical backdrop is deteriorating quickly along with our confidence in our year-end price objective.”
Investors have been on edge for weeks over Russia’s troop buildup on the Ukrainian border, with a constant barrage of news bulletins adding to the agitation, sometimes causing markets to reverse course.
On Tuesday, traders were weighing the impact of sanctions against Russia after President Vladimir Putin recognized two separatist republics in eastern Ukraine and ordered that troops be sent in, threatening to escalate the conflict.
The S&P 500 closed down 1%, with the Nasdaq 100 dropping by the same amount as even once reliable mega-cap tech stocks lagged. Oil prices, meanwhile, remained elevated, and the VIX gauge of volatility jumped.
To be sure, many who were bullish on stocks before geopolitical tensions escalated remain so, citing still-strong earnings growth, among other supporting factors. But those whose views are crumbling say the price action itself convinces them the market is in trouble.
Among the starkest warnings comes from Richard Ross, technical strategist at Evercore ISI, who says that his work continues to suggest the S&P 500 is headed toward a deep drop. He predicts a break below 4,200 could take the index to 3,600, a decline of roughly 16% from where it closed Tuesday.
“While ephemeral relief rallies will occur as the conflict ebbs and flows, the seeds of the current decline were planted by policy and the pandemic long before troops massed on the border,” he wrote in a note. He said he urged clients to fight the temptation to buy brief rallies given “the ominous specter of the highest inflation in 40 years and more hikes than meetings to combat said inflation.”
Bloomberg Intelligence’s Gina Martin Adams also says the S&P 500 is testing critical support levels that, if broken, suggest another 10% correction is ahead. The key level to watch is 4,280, and “even though the pattern may only emerge if the S&P 500 closes below that key support, a combination of weakening internals, rising interest rates, slowing growth and inflation pressure may result in a head-and-shoulders topping formation for the index,” she wrote in a note titled “Commodities May Be the Only Thing Keeping S&P 500 Above Water.”
Meanwhile, Katie Stockton, founder of Fairlead Strategies, a research firm focused on technical analysis, said stock indexes saw short-term momentum turn negative last week following a brief rally off January’s lows. The S&P 500 and the Nasdaq 100 are “at a proving ground” as they approach those January lows once again.
“There are no signs of downside exhaustion yet, suggesting these levels will be tested in the days ahead,” she wrote in a note.
©2022 Bloomberg L.P.