5 Charts Showing China Now Vs. Its 2014 Bubble
Turnover, margin debt climb like they did before last bubble.

(Bloomberg) -- The resurgence in Chinese equities is prompting comparisons with 2014, when a bubble in the nation’s stocks was starting to inflate.
Will history repeat?
There are notable similarities. Then, like now, policy makers were keen to reawaken investor interest in a stock market that had underperformed global benchmarks for years. A loosening of margin rules has spurred demand for leverage, state media are once again talking up the attractiveness of equities and the central bank is turning more accommodative as the economy slows.
The result has been a surge in stocks not seen since the boom peaked in 2015, with the Shanghai Composite Index jumping 23 percent in just two months, momentum gauges near the highest levels seen that year and demand for margin debt increasing.
Yet officials are unlikely to want another bubble to grow. The collapse of the last one, which wiped out $5 trillion in value, prompted unprecedented intervention by the authorities as they struggled to restore confidence.
“Given the experience of 2015, I think the regulator will want to make sure this doesn’t get out of control,” said Nader Naeimi, head of dynamic markets at AMP Capital Investors Ltd. which manages $120 billion. “They can’t afford to let it get out of control.”
Here’s a rundown of how the current trading environment compares with late 2014, as the rally started to accelerate:
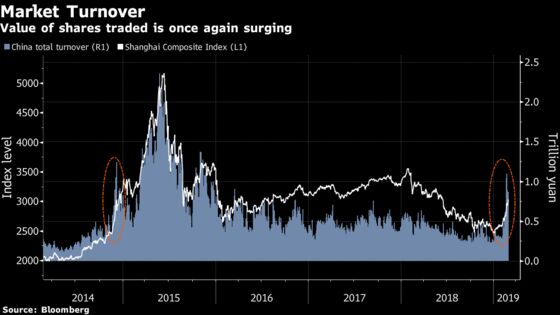
Turnover has surged, with the value of shares traded on Chinese exchanges rising above 1 trillion yuan ($149 billion) for the first time since 2015. A similar pattern emerged in late 2014 -- although, if history repeats, expect a major consolidation to occur sometime soon.
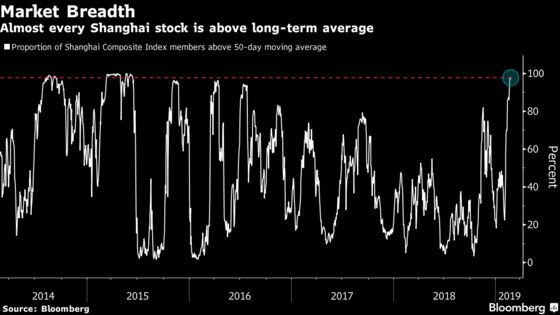
Almost all of the Shanghai Composite’s 1,500-odd members are above their long-term moving averages, showing the rally is the broadest since 2015. That breadth was also seen in late 2014.
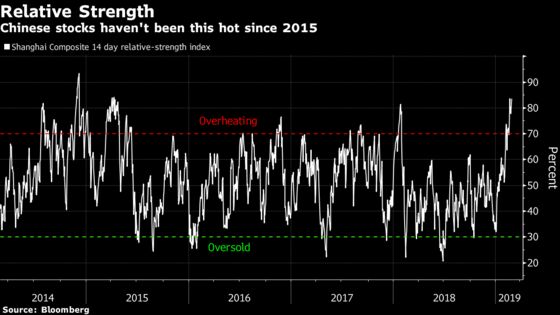
The relative strength of the Shanghai gauge has risen to 82, far above the 70 level that signals to some traders that an asset is overheating.
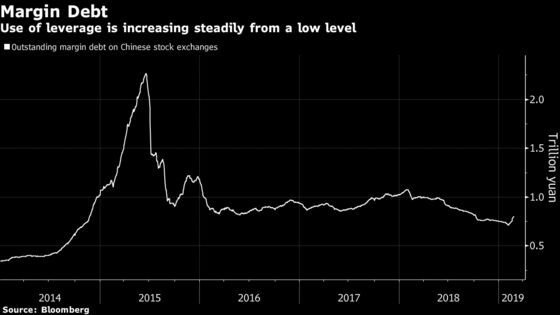
Investors boosted leverage for 14 straight days in February, the longest streak since September 2017, before trimming margin debt on Friday. In late 2014, margin debt rose for 38 sessions.
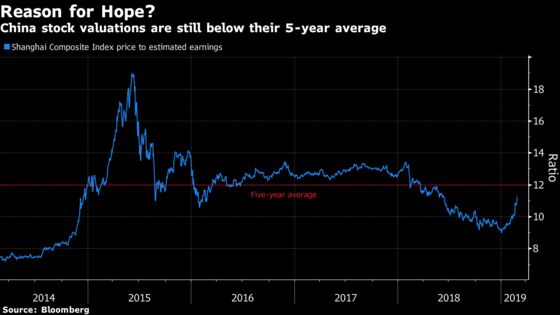
Valuations, like in 2014, are relatively cheap. Shanghai-listed securities traded at just 9 times estimated earnings at the start of the year, the lowest level since late 2014. Valuations have bounced off the four-year low but they are still below the five-year average of 12. Global equities trade at about 15 times forward earnings.
To contact Bloomberg News staff for this story: Amanda Wang in Shanghai at twang234@bloomberg.net;Mengchen Lu in Shanghai at mlu157@bloomberg.net
To contact the editors responsible for this story: Richard Frost at rfrost4@bloomberg.net, Philip Glamann
©2019 Bloomberg L.P.
With assistance from Bloomberg